chanlun缠论 - 笔与中枢Overview
The Chanlun (缠论) Strokes & Central Zones indicator is an advanced technical analysis tool based on Chinese Chan Theory (Chanlun Theory). It automatically identifies market structure through "strokes" (笔) and "central hubs" (中枢), providing traders with a systematic framework for understanding price movements, trend structure, and potential reversal zones.
Theoretical Foundation
Chan Theory is a sophisticated price action methodology that breaks down market movements into hierarchical structures:
Local Extremes: Swing highs and lows identified through lookback periods
Strokes (笔): Valid price movements between opposite extremes that meet specific criteria
Central Hubs (中枢): Consolidation zones formed by overlapping strokes, representing key support/resistance areas
Key Components
1. Local Extreme Detection
Identifies swing highs and lows using a configurable lookback period (default: 5 bars)
Only considers extremes within the specified calculation range
Forms the foundation for stroke construction
2. Stroke (笔) Identification
The indicator applies a multi-stage filtering process to identify valid strokes:
Stage 1 - Extreme Consolidation:
Merges consecutive extremes of the same type (high or low)
Keeps only the most extreme value (highest high or lowest low)
Stage 2 - Stroke Validation:
Ensures minimum bar gap between strokes (default: 4 bars)
Alternative validation: 2+ bars with >1% price change
Eliminates noise and insignificant price movements
Color Coding:
White Lines: Regular up/down strokes
Yellow Lines: Strokes that form part of a central hub
Customizable width and colors for different stroke types
3. Central Hub (中枢) Formation
A central hub forms when at least 3 consecutive strokes have overlapping price ranges:
Formation Rules:
Stroke 1:
Stroke 2:
Stroke 3:
Hub Upper = MIN(High1, High2, High3)
Hub Lower = MAX(Low1, Low2, Low3)
Valid if: Hub Upper > Hub Lower
Hub Extension:
Subsequent strokes that overlap with the hub extend it
Hub ends when a stroke no longer overlaps
Creates rectangular zones on the chart
Visual Representation:
Green rectangular boxes: Mark the time and price range of each central hub
Dashed extension lines: Show the latest hub boundaries extending to the right
Price labels on axis: Display exact hub upper and lower boundary values
4. Extreme Point Markers (Optional)
Red markers for tops (▼)
Green markers for bottoms (▲)
Marks every validated stroke extreme point
Useful for detailed structure analysis
5. Information Table (Optional)
Displays real-time statistics:
Symbol name
Current timeframe
Lookback period setting
Minimum gap setting
Total stroke count
Parameter Settings
Performance Settings
Max Bars to Calculate (3600): Limits historical calculation to improve performance
Local Extreme Lookback Period (5): Bars used to identify swing highs/lows
Min Gap Bars (4): Minimum bars required between valid strokes
Display Settings
Show Strokes: Toggle stroke line visibility
Show Central Hub: Toggle hub box visibility
Show Hub Extension Lines: Toggle dashed boundary lines
Show Extreme Point Marks: Toggle top/bottom markers
Show Info Table: Toggle statistics table
Color Settings
Full customization of:
Up/down stroke colors and widths
Hub stroke colors and widths
Hub border and background colors
Extension line colors
Trading Applications
Trend Structure Analysis
Uptrend: Series of higher highs and higher lows connected by strokes
Downtrend: Series of lower highs and lower lows connected by strokes
Consolidation: Formation of central hubs indicating range-bound movement
Support and Resistance Identification
Central Hub Zones: Act as strong support/resistance areas
Hub Upper Boundary: Resistance level in consolidation, support after breakout
Hub Lower Boundary: Support level in consolidation, resistance after breakdown
Price tends to react at these levels due to market structure memory
Breakout Trading
Bullish Breakout: Price closes above hub upper boundary
Previous resistance becomes support
Entry on retest of upper boundary
Stop loss below hub zone
Bearish Breakdown: Price closes below hub lower boundary
Previous support becomes resistance
Entry on retest of lower boundary
Stop loss above hub zone
Reversal Detection
Hub Formation After Trend: Signals potential trend exhaustion
Multiple Hub Levels: Create probability zones for reversals
Stroke Count: Excessive strokes within hub suggest weakening momentum
Position Management
Use hub boundaries for stop loss placement
Scale out positions at hub edges
Re-enter on retests of broken hub levels
Interpretation Guide
Strong Trending Market
Long, clear strokes with minimal overlap
Few or no central hubs forming
Strokes consistently in same direction
Wide spacing between extremes
Consolidating Market
Multiple central hubs forming
Short, overlapping strokes
Yellow hub strokes dominate the chart
Narrow price range
Trend Transition
Hub formation after extended trend
Stroke direction changes frequently
Hub boundaries being tested repeatedly
Potential reversal zone
Advanced Usage Techniques
Multi-Timeframe Analysis
Higher Timeframe: Identify major hub zones for overall market structure
Lower Timeframe: Find precise entry points within larger structure
Alignment: Trade when lower timeframe strokes align with higher timeframe hub breaks
Hub Quality Assessment
Wide Hubs: Strong consolidation, higher probability support/resistance
Narrow Hubs: Weak consolidation, may break easily
Extended Hubs: More strokes = stronger zone
Isolated Hubs: Single hub = potential pivot point
Stroke Analysis
Stroke Length: Longer strokes = stronger momentum
Stroke Speed: Fewer bars per stroke = explosive moves
Stroke Clustering: Many short strokes = indecision
Best Practices
Parameter Optimization
Adjust lookback period based on timeframe and volatility
Lower periods (3-4): More strokes, more noise, faster signals
Higher periods (7-10): Fewer strokes, cleaner structure, slower signals
Confirmation Strategy
Don't trade on strokes alone
Combine with volume analysis
Use candlestick patterns at hub boundaries
Wait for breakout confirmation
Risk Management
Always place stops outside hub zones
Use hub width to size positions (wider hub = smaller position)
Exit if price re-enters broken hub from wrong direction
Avoid Common Pitfalls
Don't trade within central hubs (range-bound, unpredictable)
Don't ignore higher timeframe hub structures
Don't chase strokes after they've extended far from hub
Don't trust single-stroke hubs (need 3+ strokes for validity)
Performance Considerations
Max Bars Limit: Set to 3600 to balance detail with performance
Safe Distance Calculation: Only draws objects within 2000 bars of current price
Object Cleanup: Automatically removes old drawing objects to prevent memory issues
Efficient Arrays: Uses indexed arrays for fast lookup and processing
Ideal Market Conditions
Best Performance:
Liquid markets with clear structure (major forex pairs, indices, large-cap stocks)
Trending markets with periodic consolidations
Medium to high volatility for clear stroke formation
Less Effective:
Extremely choppy, directionless markets
Very low timeframes (< 5 minutes) with excessive noise
Illiquid instruments with erratic price action
Integration with Other Indicators
Complementary Tools:
Volume Profile: Confirm hub significance with volume nodes
Moving Averages: Use for trend bias within stroke structure
RSI/MACD: Momentum confirmation at hub boundaries
Fibonacci Retracements: Hub levels often align with Fib levels
Advantages
✓ Objective Structure: Removes subjectivity from market structure analysis
✓ Visual Clarity: Color-coded strokes and clear hub zones
✓ Multi-Timeframe Applicable: Works on all timeframes from minutes to months
✓ Complete Framework: Provides entry, exit, and risk management levels
✓ Theoretical Foundation: Based on proven Chan Theory methodology
✓ Customizable: Extensive parameter and visual customization options
Limitations
⚠ Learning Curve: Requires understanding of Chan Theory principles
⚠ Lag Factor: Strokes confirm after price movements complete
⚠ Parameter Sensitivity: Different settings produce significantly different results
⚠ Choppy Market Struggles: Can generate excessive hubs in range-bound conditions
⚠ Computation Intensive: May slow down on lower-end systems with max bars setting
Optimization Tips
Timeframe Selection
Scalping: 5-15 minute charts, lookback period 3-4
Day Trading: 15-60 minute charts, lookback period 4-5
Swing Trading: 4-hour to daily charts, lookback period 5-7
Position Trading: Daily to weekly charts, lookback period 7-10
Volatility Adjustment
High volatility: Increase minimum gap bars to reduce noise
Low volatility: Decrease lookback period to capture smaller moves
Visual Optimization
Use contrasting colors for different market conditions
Adjust line widths based on chart resolution
Toggle markers off for cleaner appearance once familiar with structure
Quick Start Guide
For Beginners:
Start with default settings (5 lookback, 4 min gap)
Enable "Show Info Table" to track stroke count
Focus on identifying clear hub formations
Practice waiting for price to break hub boundaries before trading
For Advanced Users:
Optimize lookback and gap parameters for your instrument
Use hub strokes (yellow) to identify key consolidation zones
Combine with multiple timeframes for confirmation
Develop entry rules based on hub breakout/retest patterns
This indicator provides a complete structural framework for understanding market behavior through the lens of Chan Theory, offering traders a systematic approach to identifying high-probability trading opportunities.
Search in scripts for "Up down"

MA SMART Angle
### 📊 WHAT IS MA SMART ANGLE?
**MA SMART Angle** is an advanced momentum and trend detection indicator that analyzes the angles (slopes) of multiple moving averages to generate clear, non-repainting BUY and SELL signals.
**Original Concept Credit:** This indicator builds upon the "MA Angles" concept originally created by **JD** (also known as Duyck). The core angle calculation methodology and Jurik Moving Average (JMA) implementation by **Everget** are preserved from the original open-source work. The angle calculation formula was contributed by **KyJ**. This enhanced version is published with respect to the open-source nature of the original indicator.
Original indicator reference: "ma angles - JD" by Duyck
---
## 🎯 ORIGINALITY & VALUE PROPOSITION
### **What Makes This Different from the Original:**
While the original "MA Angles" by **JD** provided excellent angle visualization, it lacked actionable entry signals. **MA SMART Angle** addresses this by adding:
**1. Clear Entry/Exit Signals**
- Explicit BUY/SELL arrows based on angle crossovers, momentum confirmation, and MA alignment
- No guessing when to enter trades - the indicator tells you exactly when conditions align
**2. Non-Repainting Logic**
- All signals use confirmed historical data (shifted by 2 bars minimum)
- Critical for backtesting reliability and live trading confidence
- Original indicator could repaint signals on current bar
**3. Dual Signal System**
- **Simple Mode:** More frequent signals based on angle crossovers + momentum (for active traders)
- **Strict Mode:** Requires full multi-MA alignment + momentum confirmation (for conservative traders)
- Adaptable to different trading styles and risk tolerances
**4. Smart Signal Filtering**
- **Anti-spam cooldown:** Prevents duplicate signals within configurable bar count
- **No-trade zone detection:** Filters out low-conviction sideways markets automatically
- **Multi-timeframe MA alignment:** Ensures all moving averages agree on direction before signaling
**5. Enhanced Visualization**
- Large, clear BUY/SELL arrows with descriptive labels
- Color-coded backgrounds for market states (trending vs. ranging)
- Momentum histogram showing acceleration/deceleration in real-time
- Live status table displaying trend strength, angle value, momentum, and MA alignment
**6. Professional Alert System**
- Four distinct alert conditions: BUY Signal, SELL Signal, Strong BUY, Strong SELL
- Enables automated trade notifications and strategy integration
**7. Modified MA Periods**
- Original used EMA(27), EMA(83), EMA(278)
- Enhanced version uses faster EMA(3), EMA(8), EMA(13) for more responsive signals
- Better suited for modern volatile markets and shorter timeframes
---
## 📐 HOW IT WORKS - TECHNICAL EXPLANATION
### **Core Methodology:**
The indicator calculates angles (slopes) for five key moving averages:
- **JMA (Jurik Moving Average)** - Smooth, lag-reduced trend line (original implementation by **Everget**)
- **JMA Fast** - Responsive momentum indicator with higher power parameter
- **MA27 (EMA 3)** - Primary fast-moving average for signal generation
- **MA83 (EMA 8)** - Medium-term trend confirmation
- **MA278 (EMA 13)** - Slower trend filter
### **Angle Calculation Formula (by KyJ):**
```
angle = arctan((MA - MA ) / ATR(14)) × (180 / π)
```
**Why ATR normalization?**
- Makes angles comparable across different instruments (forex, stocks, crypto)
- Makes angles comparable across different timeframes
- Accounts for volatility - a 10-point move in different assets has different significance
**Angle Interpretation:**
- **> 15°** = Strong trend (momentum accelerating)
- **0° to 15°** = Weak trend (momentum present but moderate)
- **-2° to +2°** = No-trade zone (sideways/choppy market)
- **< -15°** = Strong downtrend
### **Signal Generation Logic:**
#### **BUY Signal Conditions:**
1. MA27 angle crosses above 0° (upward momentum initiates)
2. All three EMAs (3, 8, 13) pointing upward (trend alignment confirmed)
3. Momentum is positive for 2+ bars (acceleration, not deceleration)
4. Angle exceeds minimum threshold (not in no-trade zone)
5. Cooldown period passed (prevents signal spam)
#### **SELL Signal Conditions:**
1. MA27 angle crosses below 0° (downward momentum initiates)
2. All three EMAs pointing downward (downtrend alignment)
3. Momentum is negative for 2+ bars
4. Angle below negative threshold (not in no-trade zone)
5. Cooldown period passed
#### **Strong BUY+ / SELL+ Signals:**
Additional entry opportunities when JMA Fast crosses JMA Slow while maintaining strong directional angle - indicates momentum acceleration within established trend.
---
## 🔧 HOW TO USE
### **Recommended Settings by Trading Style:**
**Scalpers / Day Traders:**
- Signal Type: **Simple**
- Minimum Angle: **3-5°**
- Cooldown Bars: **3-5 bars**
- Timeframes: 1m, 5m, 15m
**Swing Traders:**
- Signal Type: **Strict**
- Minimum Angle: **7-10°**
- Cooldown Bars: **8-12 bars**
- Timeframes: 1H, 4H, Daily
**Position Traders:**
- Signal Type: **Strict**
- Minimum Angle: **10-15°**
- Cooldown Bars: **15-20 bars**
- Timeframes: Daily, Weekly
### **Parameter Descriptions:**
**1. Source** (default: OHLC4)
- Price data used for MA calculations
- OHLC4 provides smoothest angles
- Close is more responsive but noisier
**2. Threshold for No-Trade Zones** (default: 2°)
- Angles below this are considered sideways/ranging
- Increase for stricter filtering of choppy markets
- Decrease to allow signals in quieter trending periods
**3. Signal Type** (Simple vs. Strict)
- **Simple:** Angle crossover OR (trend + momentum)
- **Strict:** Angle crossover AND all MAs aligned AND momentum confirmed
- Start with Simple, switch to Strict if too many false signals
**4. Minimum Angle for Signal** (default: 5°)
- Only generate signals when angle exceeds this threshold
- Higher values = stronger trends required
- Lower values = more sensitive to momentum changes
**5. Cooldown Bars** (default: 5)
- Minimum bars between consecutive signals
- Prevents spam during volatile chop
- Scale with your timeframe (higher TF = more bars)
**6. Color Bars** (default: true)
- Colors chart bars based on signal state
- Green = bullish conditions, Red = bearish conditions
- Can disable if you prefer clean price bars
**7. Background Colors**
- **Yellow background** = No-trade zone (low angle, ranging market)
- **Green flash** = BUY signal generated
- **Red flash** = SELL signal generated
- All customizable or can be disabled
---
## 📊 INTERPRETING THE INDICATOR
### **Visual Elements:**
**Main Chart Window:**
- **Thick Lime/Fuchsia Line** = MA27 angle (primary signal line)
- **Medium Green/Red Line** = MA83 angle (trend confirmation)
- **Thin Green/Red Line** = MA278 angle (slow trend filter)
- **Aqua/Orange Line** = JMA Fast (momentum detector)
- **Green/Red Area** = JMA slope (overall trend context)
- **Blue/Purple Histogram** = Momentum (angle acceleration/deceleration)
**Signal Arrows:**
- **Large Green ▲ "BUY"** = Primary buy signal (all conditions met)
- **Small Green ▲ "BUY+"** = Strong momentum buy (JMA fast cross)
- **Large Red ▼ "SELL"** = Primary sell signal (all conditions met)
- **Small Red ▼ "SELL+"** = Strong momentum sell (JMA fast cross)
**Status Table (Top Right):**
- **Angle:** Current MA27 angle in degrees
- **Trend:** Classification (STRONG UP/DOWN, UP/DOWN, FLAT)
- **Momentum:** Acceleration state (ACCEL UP/DN, Up/Down)
- **MAs:** Alignment status (ALL UP/DOWN, Mixed)
- **Zone:** Trading zone status (ACTIVE vs. NO TRADE)
- **Last:** Bars since last signal
### **Trading Strategies:**
**Strategy 1: Pure Signal Following**
- Enter LONG on BUY signal
- Exit on SELL signal
- Use stop-loss at recent swing low/high
- Works best on trending instruments
**Strategy 2: Confirmation with Price Action**
- Wait for BUY signal + bullish candlestick pattern
- Wait for SELL signal + bearish candlestick pattern
- Increases win rate by filtering premature signals
- Recommended for beginners
**Strategy 3: Momentum Acceleration**
- Use BUY+/SELL+ signals for adding to positions
- Only take these in direction of primary signal
- Scalp quick moves during momentum spikes
- For experienced traders
**Strategy 4: Mean Reversion in No-Trade Zones**
- When status shows "NO TRADE", fade extremes
- Wait for angle to exit no-trade zone for reversal
- Contrarian approach for range-bound markets
- Requires tight stops
---
## ⚠️ LIMITATIONS & DISCLAIMERS
**What This Indicator DOES:**
✅ Measures momentum direction and strength via angle analysis
✅ Generates signals when multiple conditions align
✅ Filters out low-conviction sideways markets
✅ Provides visual clarity on trend state
**What This Indicator DOES NOT:**
❌ Predict future price movements with certainty
❌ Guarantee profitable trades (no indicator can)
❌ Work equally well on all instruments/timeframes
❌ Replace proper risk management and position sizing
**Known Limitations:**
- **Lagging Nature:** Like all moving averages, signals occur after momentum begins
- **Whipsaw Risk:** Can generate false signals in volatile, directionless markets
- **Optimization Required:** Parameters need adjustment for different assets
- **Not a Complete System:** Should be combined with risk management, position sizing, and other analysis
**Best Performance Conditions:**
- Strong trending markets (crypto bull runs, stock breakouts)
- Liquid instruments (major forex pairs, large-cap stocks)
- Appropriate timeframe selection (match to trading style)
- Used alongside support/resistance and volume analysis
---
## 🔔 ALERT SETUP
The indicator includes four alert conditions:
**1. BUY SIGNAL**
- Message: "MA SMART Angle: BUY SIGNAL! Angle crossed up with momentum"
- Use for: Primary long entries
**2. SELL SIGNAL**
- Message: "MA SMART Angle: SELL SIGNAL! Angle crossed down with momentum"
- Use for: Primary short entries or long exits
**3. Strong BUY**
- Message: "MA SMART Angle: Strong BUY momentum - JMA fast crossed up"
- Use for: Adding to longs or aggressive entries
**4. Strong SELL**
- Message: "MA SMART Angle: Strong SELL momentum - JMA fast crossed down"
- Use for: Adding to shorts or aggressive exits
**Setting Up Alerts:**
1. Right-click indicator → "Add Alert on MA SMART Angle"
2. Select desired condition from dropdown
3. Choose notification method (popup, email, webhook)
4. Set alert expiration (typically "Once Per Bar Close")
---
## 📚 EDUCATIONAL VALUE
This indicator serves as an excellent learning tool for understanding:
**1. Angle-Based Momentum Analysis**
- Traditional indicators show MA crossovers
- This shows the *rate of change* (velocity) of MAs
- Teaches traders to think in terms of momentum acceleration
**2. Multi-Timeframe Confirmation**
- Shows how fast, medium, and slow MAs interact
- Demonstrates importance of trend alignment
- Helps develop patience for high-probability setups
**3. Signal Quality vs. Quantity Tradeoff**
- Simple mode = more signals, more noise
- Strict mode = fewer signals, higher quality
- Teaches discretionary filtering skills
**4. Market State Recognition**
- Visual distinction between trending and ranging markets
- Helps traders avoid trading choppy conditions
- Develops "market context" awareness
---
## 🔄 DIFFERENCES FROM OTHER MA INDICATORS
**vs. Traditional MA Crossovers:**
- Measures momentum (angle) rather than just price crossing MA
- Provides earlier signals as angles change before price crosses
- Filters better for sideways markets using no-trade zones
**vs. MACD:**
- Uses multiple MAs instead of just two
- ATR normalization makes it universal across instruments
- Visual angle representation more intuitive than histogram
**vs. Supertrend:**
- Not based on ATR bands but on MA slope analysis
- Provides graduated strength indication (not just binary trend)
- Less prone to whipsaw in low volatility
**vs. Original "MA Angles" by JD:**
- Adds explicit entry/exit signals (original had none)
- Implements no-repaint logic for reliability
- Includes signal filtering and quality controls
- Provides dual signal systems (Simple/Strict)
- Enhanced visualization and status monitoring
- Uses faster MA periods (3/8/13 vs 27/83/278) for modern markets
---
## 📖 CODE STRUCTURE (for Pine Script learners)
This indicator demonstrates:
**Advanced Pine Script Techniques:**
- Custom function implementation (JMA, angle calculation)
- Var declarations for stateful tracking
- Table creation for HUD display
- Multi-condition signal logic
- Alert system integration
- Proper use of historical references for no-repaint
**Code Organization:**
- Modular function definitions (JMA, angle)
- Clear separation of concerns (inputs, calculations, plotting, alerts)
- Extensive commenting for maintainability
- Best practices for Pine Script v5
**Learning Resources:**
- Study the JMA function to understand adaptive smoothing
- Examine angle calculation for ATR normalization technique
- Review signal logic for multi-condition confirmation patterns
- Analyze anti-spam filtering for state management
The code is open-source - feel free to study, modify, and improve upon it!
---
## 🙏 CREDITS & ATTRIBUTION
**Original Concepts:**
- **"ma angles - JD" by JD (Duyck)** - Core angle calculation methodology and indicator concept
Original open-source indicator on TradingView Community Scripts
- **JMA (Jurik Moving Average) implementation by Everget** - Smooth, low-lag moving average function
Acknowledged in original JD indicator code
- **Angle Calculation formula by KyJ** - Mathematical formula for converting MA slope to degrees using ATR normalization
Acknowledged in original JD indicator code comments
**Enhancements in This Version:**
- Signal generation logic - Original implementation for this indicator
- No-repaint confirmation system - Original implementation
- Dual signal modes (Simple/Strict) - Original implementation
- Visual enhancements and status table - Original implementation
- Alert system and signal filtering - Original implementation
- Modified MA periods (3/8/13 instead of 27/83/278) - Optimization for modern markets
**Open Source Philosophy:**
This indicator follows the open-source spirit of TradingView and the Pine Script community. The original "ma angles - JD" by JD (Duyck) was published as open-source, enabling this enhanced version. Similarly, this code is published as open-source to allow further community improvements.
---
## ⚡ QUICK START GUIDE
**For New Users:**
1. Add indicator to chart
2. Start with default settings (Simple mode)
3. Wait for BUY signal (green arrow)
4. Observe how price behaves after signal
5. Check status table to understand market state
6. Adjust parameters based on your instrument/timeframe
**For Experienced Traders:**
1. Switch to Strict mode for higher quality signals
2. Increase cooldown bars to reduce frequency
3. Raise minimum angle threshold for stronger trends
4. Combine with your existing strategy for confirmation
5. Set up alerts for desired signal types
6. Backtest on your preferred instruments
---
## 🎓 RECOMMENDED COMBINATIONS
**Works Well With:**
- **Volume Analysis:** Confirm signals with volume spikes
- **Support/Resistance:** Take signals near key levels
- **RSI/Stochastic:** Avoid overbought/oversold extremes
- **ATR:** Size positions based on volatility
- **Price Action:** Wait for candlestick confirmation
**Complementary Indicators:**
- Order Flow / Footprint (for institutional confirmation)
- Volume Profile (for identifying value areas)
- VWAP (for intraday mean reversion reference)
- Fibonacci Retracements (for target setting)
---
## 📈 PERFORMANCE EXPECTATIONS
**Realistic Win Rates:**
- Simple Mode: 45-55% (higher frequency, moderate accuracy)
- Strict Mode: 55-65% (lower frequency, higher accuracy)
- Combined with price action: 60-70%
**Best Asset Classes:**
1. **Cryptocurrencies** (strong trends, clear signals)
2. **Forex Major Pairs** (smooth price action, good angles)
3. **Large-Cap Stocks** (trending behavior, liquid)
4. **Index Futures** (trending instruments)
**Challenging Conditions:**
- Low volatility consolidation periods
- News-driven erratic movements
- Thin/illiquid instruments
- Counter-trending markets
---
## 🛡️ RISK DISCLAIMER
**IMPORTANT LEGAL NOTICE:**
This indicator is for **educational and informational purposes only**. It is **NOT financial advice** and does not constitute a recommendation to buy or sell any financial instrument.
**Trading Risks:**
- Trading carries substantial risk of loss
- Past performance does not guarantee future results
- No indicator can predict market movements with certainty
- You can lose more than your initial investment (especially with leverage)
**User Responsibilities:**
- Conduct your own research and due diligence
- Understand the instruments you trade
- Never risk more than you can afford to lose
- Use proper position sizing and risk management
- Consider consulting a licensed financial advisor
**Indicator Limitations:**
- Signals are based on historical data only
- No guarantee of accuracy or profitability
- Parameters must be optimized for your specific use case
- Results vary significantly by market conditions
By using this indicator, you acknowledge and accept all trading risks. The author is not responsible for any financial losses incurred through use of this indicator.
---
## 📧 SUPPORT & FEEDBACK
**Found a bug?** Please report it in the comments with:
- Chart symbol and timeframe
- Parameter settings used
- Description of unexpected behavior
- Screenshot if possible
**Have suggestions?** Share your ideas for improvements!
**Enjoying the indicator?** Leave a like and follow for updates!

Multi EMA + Indicators + Mini-Dashboard + Reversals v6📘 Multi EMA + Indicators + Mini-Dashboard + Reversals v6
🧩 Overview
This indicator is a multi-EMA setup that combines trend, momentum, and reversal analysis in a single visual framework.
It integrates four exponential moving averages (EMAs), key oscillators (RSI, MACD, Stochastic, CCI), volatility filtering (ATR), and a dynamic mini-dashboard that summarizes all signals in real time.
Its purpose is to help traders visually confirm trend alignment, filter valid entries, and identify possible trend continuation or reversal points.
It can display buy/sell arrows, detect reversal candles, and issue alerts when trading conditions are met.
⚙️ Core Components
1. Moving Averages (EMA Setup)
EMA1 (fast) and EMA2 (medium) define the short-term trend and trigger bias.
When the price is above both EMAs → bullish bias.
When below → bearish bias.
EMA3 and EMA4 act as trend filters. Their slopes (up or down) confirm overall momentum and help validate signals.
Each EMA has customizable lengths, sources, and colors for up/down trends.
This “EMA stack” is the foundation of the setup — a structured trend-following framework that adapts to market speed and volatility.
2. Momentum and Confirmation Filters
Each indicator can be individually enabled or disabled for flexibility.
RSI: confirms direction (above/below 50).
MACD: detects momentum crossover (MACD > Signal for bullish confirmation).
Stochastic: identifies trend continuation (K > D for longs, K < D for shorts).
CCI: adds trend bias above/below a threshold.
ATR Filter: filters out small, low-volatility candles to reduce noise.
You can activate only the filters that fit your trading plan — for instance, trend traders often use RSI and MACD, while scalpers may rely on Stochastic and ATR.
3. Reversal Detection
The indicator includes an optional Reversal Section that independently detects potential turning points.
It combines multiple configurable criteria:
Candlestick patterns (Bullish Hammer, Shooting Star).
Large Candle filter — detects unusually large bars (relative to close).
Price-to-EMA distance — identifies overextended moves that might revert.
RSI Divergence — detects potential momentum shifts.
RSI Overbought/Oversold zones (70/30 by default).
Doji Candles — sign of indecision.
A bullish or bearish reversal signal appears when enough selected criteria are met.
All sub-modules can be toggled on/off individually, giving you full control over sensitivity.
4. Signal Logic
Buy and sell signals are triggered when EMA alignment and the chosen confirmations agree:
Buy Signal
→ Price above EMA1 & EMA2
→ Confirmations (RSI/MACD/Stoch/CCI/ATR) pass
→ Trend filters (EMA3/EMA4) point upward
Sell Signal
→ Price below EMA1 & EMA2
→ Confirmations align bearishly
→ Trend filters (EMA3/EMA4) slope downward
Reversal signals can appear independently, even against the current EMA trend, depending on your settings.
5. Visual Dashboard
A mini-dashboard appears near the chart showing:
Current trade bias (LONG / SHORT / NEUTRAL)
EMA3 and EMA4 trend directions (↑ / ↓)
Quick visual bars (🟩 / 🟥) for each filter: RSI, MACD, Stoch, ATR, CCI, EMA filters
Reversal criteria status (Doji, RSI divergence, candle size, etc.)
This panel gives you a compact overview of all indicator states at a glance.
The color of the panel changes dynamically — green for bullish, red for bearish, gray for neutral.
6. Alerts
Built-in alerts allow automation or notifications:
Buy Alert
Sell Alert
Reversal Buy
Reversal Sell
You can connect these alerts to TradingView notifications or external bots for semi-automated execution.
💡 How to Use
✅ Trend-Following Setup
Focus on trades in the direction of EMA1 & EMA2.
Confirm with EMA3 & EMA4 trending in the same direction.
Use RSI/MACD/Stoch filters to ensure momentum supports the trade.
Avoid entries when ATR filter indicates low volatility.
🔄 Reversal Setup
Enable the Reversal section for potential tops/bottoms.
Look for reversal buy signals near support zones or after strong downtrends.
Use RSI divergence or Doji + Hammer signals as confirmation.
Combine with key chart areas (supply/demand or previous swing levels).
⚖️ Combination Approach
Trade continuation signals when all EMAs are aligned and filters are green.
Trade reversals only when at a key area (support/resistance) and confirmed by reversal conditions.
Always check higher-timeframe bias before entering a trade.
🧭 Practical Tips
Use different EMA sets for different timeframes:
9/21/50/100 for swing or trend trades.
5/13/34/89 for intraday scalping.
Turn off filters you don’t use to reduce lag.
Always validate signals with price structure, not just indicator alignment.
Practice in replay mode before live trading.
🗺️ Key Chart Confluence (Highly Recommended)
Although the indicator provides structured signals, its best use is in confluence with:
Support and resistance levels
Supply/demand zones
Trendlines and channels
Liquidity pools
Volume clusters
Signals aligned with strong key areas on the chart tend to have greater reliability than isolated indicator triggers.
I use EMA 1 - 20 Open ; EMA 2 - 20 Close ; EMA 3 - 50 ; EMA 4 - 200 or 100 , but that's me...
⚠️ Important Disclaimer
This indicator is a technical tool, not a guarantee of results.
Trading involves risk, and no signal is ever 100% accurate.
Every trader should develop a personal strategy, use proper risk management, and adapt settings to their instrument and timeframe.
Always combine indicator signals with key chart areas, higher-timeframe context, and your own analysis before taking a trade.

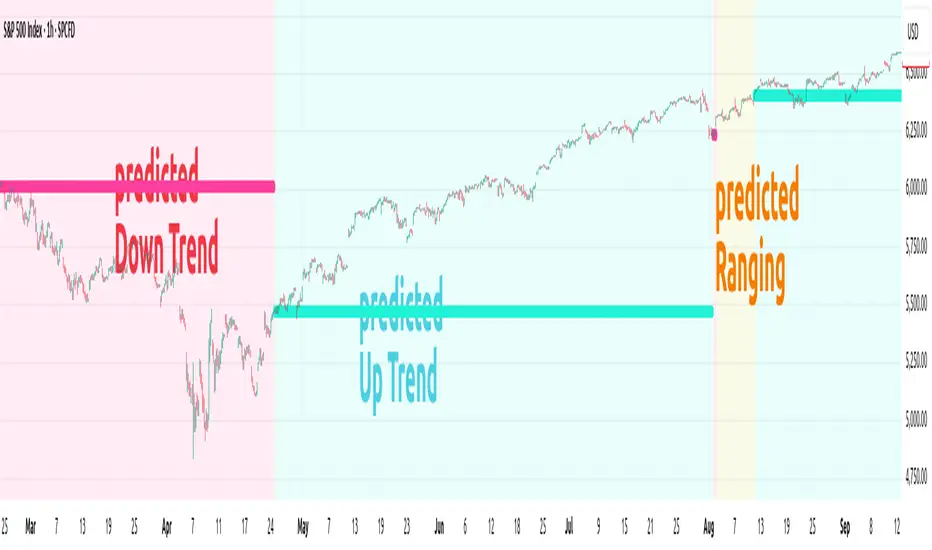
ANN TREND SPX500 1m-1HHappy Trading! This indicator is the successor to my previous ANN Trend Prediction, now featuring improved feature vectors, refined backpropagation, and a stronger focus on asset- and timeframe-specific patterns for more precise predictions.
Internally is a collection of nine artificial neural networks (ANNs) trained on the S&P 500 to forecast uptrends, downtrends, or ranging markets. Each ANN is trained on one of the following timeframes: 1m, 2m, 3m, 5m, 10m, 15m, 30m, 45m, and 60m, and the appropriate model is selected automatically.
1. Settings
In the settings menu shown in the image below, you’ll find six options:
Indicator Timeframe – Choose between 1m and 1H.
Intrabar – Choose between Alerts been send intrabar or only at bar closing.
Lookback – Define how many previous bars the ANN should use in its calculations.
Smoothing – To reduce short-term switching of the prediction you can activate Smoothing. Here-by the input datas get filtered by a mean function.
Range Filter – Enable a third class, Ranging, in addition to Uptrend and Downtrend. This enables you to avoid choppy markets.
Class Colors – Here you can change each Class (Up, Down Trend etc) color.
2. Comparison with EMA crossover
The Prediction of the ANN Trend SPX500 1m-1H is more reliable as the prediction of the EMA crossover, shown in the Image below.
Both indicators use the same period of 65 bars and source their input data from the same chart.
While the EMA crosses over multiple times (shown as red vertical lines in the image), the ANN Trend maintains its prediction signal as Uptrend.
This advantage of the ANN comes from its learned knowledge. During training, it was exposed to a vast number of price charts, enabling it to distinguish between a trend setback and a true trend reversal.
3. Alerts
The indicator generates two types of alert signals:
Trade Signal:
1 = Uptrend
0 = Ranging
-1 = Downtrend
-2 = no prediction
Signal Age: Counts the number of bars since the last signal change. With the Signal Age you have access to the entry-price of the actual Trend. If you use You just call close to get the last entry-price.
4. Declaration for TradingView House Rules on Script Publishing
The unique feature of ANN Trend SPX500 1m-1H is it's real-time range detection capability and it's capability to distinguishes between a Trend set back and a Trend reversal which results in longer lasting trend predictions in comparison to any Moving Average Crossover Indicators.
This script is closed-source and invite-only, to support and compensate for months of development work.
5. Disclaimer
Trading involves risk, and losses can and do occur. This script is intended for informational and educational purposes only. All examples are hypothetical and not financial advice.
Decisions to buy, sell, hold, or trade securities, commodities, or other assets should be based on the advice of qualified financial professionals. Past performance does not guarantee future results.
Use this script at your own risk. It may contain bugs, and I cannot be held responsible for any financial losses resulting from its use.
Cheers!
Cora Combined Suite v1 [JopAlgo]Cora Combined Suite v1 (CCSV1)
This is an 2 in 1 indicator (Overlay & Oscillator) the Cora Combined Suite v1 .
CCSV1 combines a price-pane Overlay for structure/trend with a compact Oscillator for timing/pressure. It’s designed to be clear, beginner-friendly, and largely automatic: you pick a profile (Scalp / Intraday / Swing), choose whether to run as Overlay or Oscillator, and CCSV1 tunes itself in the background.
What’s inside — at a glance
1) Overlay (price pane)
CoRa Wave: a smooth trend line based on a compound-ratio WMA (CRWMA).
Green when the slope rises (bull bias), Red when it falls (bear bias).
Asymmetric ATR Cloud around the CoRa Wave
Width expands more up when buyer pressure dominates and more down when seller pressure dominates.
Fill is intentionally light, so candlesticks remain readable.
Chop Guard (Range-Lock Gate)
When the cloud stays very narrow versus ATR (classic “dead water”), pullback alerts are muted to avoid noise.
Visuals don’t change—only the alerting logic goes quiet.
Typical Overlay reads
Trend: Follow the CoRa color; green favors long setups, red favors shorts.
Value: Pullbacks into/through the cloud in trend direction are higher-quality than chasing breaks far outside it.
Dominance: A visibly asymmetric cloud hints which side is funding the move (buyers vs sellers).
2) Oscillator (subpane or inline preview)
Stretch-Z (columns): how far price is from the CoRa mean (mean-reversion context), clipped to ±clip.
Near 0 = equilibrium; > +2 / < −2 = stretched/extended.
Slope-Z (line): z-score of CoRa’s slope (momentum of the trend line).
Crossing 0 upward = potential bullish impulse; downward = potential bearish impulse.
VPO (stepline): a normalized Volume-Pressure read (positive = buyers funding, negative = sellers).
Rendered as a clean stepline to emphasize state changes.
Event Bands ±2 (subpane): thin reference lines to spot extension/exhaustion zones fast.
Floor/Ceiling lines (optional): quiet boundaries so the panel doesn’t feel “bottomless.”
Inline vs Subpane
Inline (overlay): the oscillator auto-anchors and scales beneath price, so it never crushes the price scale.
Subpane (raw): move to a new pane for the classic ±clip view (with ±2 bands). Recommended for systematic use.
Why traders like it
Two in one: Structure on the chart, timing in the panel—built to complement each other.
Retail-first automation: Choose Scalp / Intraday / Swing and let CCSV1 auto-tune lengths, clips, and pressure windows.
Robust statistics: On fast, spiky markets/timeframes, it prefers outlier-resistant math automatically for steadier signals.
Optional HTF gate: You can require higher-timeframe agreement for oscillator alerts without changing visuals.
Quick start (simple playbook)
Run As
Overlay for structure: assess trend direction, where value is (the cloud), and whether chop guard is active.
Oscillator for timing: move to a subpane to see Stretch-Z, Slope-Z, VPO, and ±2 bands clearly.
Profile
Scalp (1–5m), Intraday (15–60m), or Swing (4H–1D). CCSV1 adjusts length/clip/pressure windows accordingly.
Overlay entries
Trade with CoRa color.
Prefer pullbacks into/through the cloud (trend direction).
If chop guard is active, wait; let the market “breathe” before engaging.
Oscillator timing
Look for Funded Flips: Slope-Z crossing 0 in the direction of VPO (i.e., momentum + funded pressure).
Use ±2 bands to manage risk: stretched conditions can stall or revert—better to scale or wait for a clean reset.
Optional HTF gate
Enable to green-light only those oscillator alerts that align with your chosen higher timeframe.
What each signal means (plain language)
CoRa turns green/red (Overlay): trend bias shift on your chart.
Cloud width tilts asymmetrically: one side (buyers/sellers) is dominating; extensions on that side are more likely.
Stretch-Z near 0: fair value around CoRa; pullback timing zone.
Stretch-Z > +2 / < −2: extended; watch for slowing momentum or scale decisions.
Slope-Z cross up/down: new impulse starting; combine with VPO sign to avoid unfunded crosses.
VPO positive/negative: net buying/selling pressure funding the move.
Alerts included
Overlay
Pullback Long OK
Pullback Short OK
Oscillator
Funded Flip Up / Funded Flip Down (Slope-Z crosses 0 with VPO agreement)
Pullback Long Ready / Pullback Short Ready (near equilibrium with aligned momentum and pressure)
Exhaustion Risk (Long/Short) (Stretch-Z beyond ±2 with weakening momentum or pressure)
Tip: Keep chart alerts concise and use strategy rules (TP/SL/filters) in your trade plan.
Best practices
One glance workflow
Read Overlay for direction + value.
Use Oscillator for trigger + confirmation.
Pairing
Combine with S/R or your preferred execution framework (e.g., your JopAlgo setups).
The suite is neutral: it won’t force trades; it highlights context and quality.
Markets
Works on crypto, indices, FX, and commodities.
Where real volume is available, VPO is strongest; on synthetic volume, treat VPO as a soft filter.
Timeframes
Use the Profile preset closest to your style; feel free to fine-tune later.
For multi-TF trading, enable the HTF gate on the oscillator alerts only.
Inputs you’ll actually use (the rest can stay on Auto)
Run As: Overlay or Oscillator.
Profile: Scalp / Intraday / Swing.
Oscillator Render: “Subpane (raw)” for a classic panel; “Inline (overlay)” only for a quick preview.
HTF gate (optional): require higher-timeframe Slope-Z agreement for oscillator alerts.
Everything else ships with sensible defaults and auto-logic.
Limitations & tips
Not a strategy: CCSV1 is a decision support tool; you still need your entry/exit rules and risk management.
Non-repainting design: Signals finalize on bar close; intrabar graphics can adjust during the bar (Pine standard).
Very flat sessions: If price and volume are extremely quiet, expect fewer alerts; that restraint is intentional.
Who is this for?
Beginners who want one clean overlay for structure and one simple oscillator for timing—without wrestling settings.
Intermediates seeking a coherent trend/pressure framework with HTF confirmation.
Advanced users who appreciate robust stats and clean engineering behind the visuals.
Disclaimer: Educational purposes only. Not financial advice. Trading involves risk. Use at your own discretion.

Quantum Fluxtrend [CHE] Quantum Fluxtrend — A dynamic Supertrend variant with integrated breakout event tracking and VWAP-guided risk management for clearer trend decisions.
Summary
The Quantum Fluxtrend builds on traditional Supertrend logic by incorporating a midline derived from smoothed high and low values, creating adaptive bands that respond to market range expansion or contraction. This results in fewer erratic signals during volatile periods and smoother tracking in steady trends, while an overlaid event system highlights breakout confirmations, potential traps, or continuations with visual lines, labels, and percentage deltas from the close. Users benefit from real-time VWAP calculations anchored to events, providing dynamic stop-loss suggestions to help manage exits without manual adjustments. Overall, it layers signal robustness with actionable annotations, reducing noise in fast-moving charts.
Motivation: Why this design?
Standard Supertrend indicators often generate excessive flips in choppy conditions or lag behind in low-volatility drifts, leading to whipsaws that erode confidence in trend direction. This design addresses that by centering bands around a midline that reflects recent price spreads, ensuring adjustments are proportional to observed variability. The added event layer captures regime shifts explicitly, turning abstract crossovers into labeled milestones with trailing VWAP for context, which helps traders distinguish genuine momentum from fleeting noise without over-relying on raw price action.
What’s different vs. standard approaches?
- Baseline reference: Diverges from the classic Supertrend, which uses average true range for fixed offsets from a median price.
- Architecture differences:
- Bands form around a central line averaged from smoothed highs and lows, with offsets scaled by half the range between those smooths.
- Regime direction persists until a clear breach of the prior opposite band, preventing premature reversals.
- Event visualization draws persistent lines from flip points, updating labels based on price sustainment relative to the trigger level.
- VWAP resets at each event, accumulating volume-weighted prices forward for a trailing reference.
- Practical effect: Charts show fewer direction changes overall, with color-coded annotations that evolve from initial breakout to continuation or trap status, making it easier to spot sustained moves early. VWAP lines provide a volume-informed anchor that curves with price, offering visual cues for adverse drifts.
How it works (technical)
The process starts by smoothing high and low prices over a user-defined period to form upper and lower references. A midline sits midway between them, and half the spread acts as a base for band offsets, adjusted by a multiplier to widen or narrow sensitivity. On each bar, the close is checked against the previous bar's opposite band: crossing above expands the lower band downward in uptrends, or below contracts the upper band upward in downtrends, creating a ratcheting effect that locks in direction until breached.
Persistent state tracks the current regime, seeding initial bands from the smoothed values if no prior data exists. Flips trigger new horizontal lines at the breach level, styled by direction, alongside labels that monitor sustainment—price holding above for up-flips or below for down-flips keeps the regime, while reversal flags a trap.
Separately, at each flip, a dashed VWAP line initializes at the breach price and extends forward, accumulating the product of typical prices and volumes divided by total volume. This yields a curving reference that updates bar-by-bar. Warnings activate if price strays adversely from this VWAP, tinting the background for quick alerts.
No higher timeframe data is pulled, so all computations run on the chart's native resolution, avoiding lookahead biases unless repainting is enabled via input.
Parameter Guide
SMA Length — Controls smoothing of highs and lows for midline and range base; longer values dampen noise but increase lag. Default: 20. Trade-offs: Shortens responsiveness in trends (e.g., 10–14) but risks more flips; extend to 30+ for stability in ranging markets.
Multiplier — Scales band offsets from the half-range; higher amplifies to capture bigger swings. Default: 1.0. Trade-offs: Above 1.5 widens for volatile assets, reducing false signals; below 0.8 tightens for precision but may miss subtle shifts.
Show Bands — Toggles visibility of basic and adjusted band lines for reference. Default: false. Tip: Enable briefly to verify alignment with price action.
Show Background Color — Displays red tint on VWAP adverse crosses for visual warnings. Default: false. Trade-offs: Helps in live monitoring but can clutter clean charts.
Line Width — Sets thickness for event and VWAP lines. Default: 2. Tip: Thicker (3–5) for emphasis on key levels.
+Bars after next event — Extends old lines briefly before cleanup on new flips. Default: 20. Trade-offs: Longer preserves history (40+) at resource cost; shorter keeps charts tidy.
Allow Repainting — Permits live-bar updates for smoother real-time view. Default: false. Tip: Disable for backtest accuracy.
Extension 1 Settings (Show, Width, Size, Decimals, Colors, Alpha) — Manages dotted connector from event label to current close, showing percentage change. Defaults: Shown, width 2, normal size, 2 decimals, lime/red for gains/losses, gray line, 90% transparent background. Trade-offs: Fewer decimals for clean display; adjust alpha for readability.
Extension 2 Settings (Show, Method, Stop %, Ticks, Decimals, Size, Color, Inherit, Alpha) — Positions stop label at VWAP end, offset by percent or ticks. Defaults: Shown, percent method, 1.0%, 20 ticks, 4 decimals, normal size, white text, inherit tint, 0% alpha. Trade-offs: Percent for proportional risk; ticks for fixed distance in tick-based assets.
Alert Toggles — Enables notifications for breakouts, continuations, traps, or VWAP warnings. All default: true. Tip: Layer with chart alerts for multi-condition setups.
Reading & Interpretation
The main Supertrend line colors green for up-regimes (price above lower band) and red for down (below upper band), serving as a dynamic support/resistance trail. Flip shapes (up/down triangles) mark regime changes at band breaches.
Event lines extend horizontally from flips: green for bull, red for bear. Labels start blank and update to "Bull/Bear Cont." if price sustains the direction, or "Trap" if it reverses, with colors shifting lime/red/gray accordingly. A dotted vertical links the trailing label to the current close, mid-labeled with the percentage delta (positive green, negative red).
VWAP dashes yellow (bull) or orange (bear) from the event, curving to reflect volume-weighted average. At its end, a left-aligned label shows suggested stop price, annotated with offset details. Background red hints at weakening if price crosses VWAP opposite the regime.
Deltas near zero suggest consolidation; widening extremes signal momentum buildup or exhaustion.
Practical Workflows & Combinations
- Trend following: Enter long on green flip shapes confirmed by higher highs, using the event line as initial stop below. Trail stops to VWAP for bull runs, exiting on trap labels or red background warnings. Filter with volume spikes to avoid low-conviction breaks.
- Exits/Stops: Conservative: Set hard stops at suggested SL labels. Aggressive: Hold through minor traps if delta stays positive, but cut on regime flip. Pair with momentum oscillators for overbought pullbacks.
- Multi-asset/Multi-TF: Defaults suit forex/stocks on 15m–4H; for crypto, bump multiplier to 1.5 for volatility. Scale SMA length proportionally across timeframes (e.g., double for daily). Combine with structure tools like Fibonacci for confluence on event lines.
Behavior, Constraints & Performance
Live bars update lines and labels dynamically if repainting is allowed, but signals confirm on close for stability—flips only trigger post-bar. No higher timeframe calls, so no inherent lookahead, though volume weighting assumes continuous data.
Resources cap at 1000 bars back, 50 lines/labels max; events prune old ones on new flips to stay under budget, with brief extensions for visibility. Arrays or loops absent, keeping it lightweight.
Known limits include lag in extreme gaps (e.g., overnight opens) where bands may not adjust instantly, and VWAP sensitivity to sparse volume in illiquid sessions.
Sensible Defaults & Quick Tuning
Start with SMA 20, multiplier 1.0 for balanced response across majors. For choppy pairs: Lengthen SMA to 30, multiplier 0.8 to tighten bands and cut flips. For trending equities: Shorten to 14, multiplier 1.2 for quicker entries. If traps dominate, enable bands to inspect range compression; for sluggish signals, reduce extension bars to focus on recent events.
What this indicator is—and isn’t
This serves as a visualization and signal layer for trend regimes and breakouts, highlighting sustainment via annotations and risk cues through VWAP—ideal atop price action for confirmation. It is not a standalone system, predictive oracle, or risk calculator; always integrate with broader analysis, position sizing, and stops. Use responsibly as an educational tool.
Disclaimer
The content provided, including all code and materials, is strictly for educational and informational purposes only. It is not intended as, and should not be interpreted as, financial advice, a recommendation to buy or sell any financial instrument, or an offer of any financial product or service. All strategies, tools, and examples discussed are provided for illustrative purposes to demonstrate coding techniques and the functionality of Pine Script within a trading context.
Any results from strategies or tools provided are hypothetical, and past performance is not indicative of future results. Trading and investing involve high risk, including the potential loss of principal, and may not be suitable for all individuals. Before making any trading decisions, please consult with a qualified financial professional to understand the risks involved.
By using this script, you acknowledge and agree that any trading decisions are made solely at your discretion and risk.
Do not use this indicator on Heikin-Ashi, Renko, Kagi, Point-and-Figure, or Range charts, as these chart types can produce unrealistic results for signal markers and alerts.
Best regards and happy trading
Chervolino

SuperTrend Cyan — Split ST & Triple Bands (A/B/C)SuperTrend Cyan — Split ST & Triple Bands (A/B/C)
✨ Concept:
The SuperTrend Cyan indicator expands the classical SuperTrend logic into a split-line + triple-band visualization for clearer structure and volatility mapping.
Instead of a single ATR-based line, this tool separates SuperTrend direction from volatility envelopes (A/B/C), providing a layered view of both regime and range compression.
✨ The design goal:
Preserve the simplicity of SuperTrend
Add volatility context via multi-band envelopes
Provide a compact MTF (Multi-Timeframe) summary for broader trend alignment
✨ How It Works
1. SuperTrend Core (Active & Opposite Lines)
Uses ATR-based bands (Factor × ATR-Length).
Active SuperTrend is plotted according to current regime.
Opposite SuperTrend (optional) shows potential reversal threshold.
2. Triple Band System (A/B/C)
Each band (A, B, C) scales from the median price (hl2) by different ATR multipliers.
A: Outer band (wider, long-range context)
B: Inner band (mid-range activity)
C: Core band (closest to price, short-term compression)
Smoothness can be controlled with EMA.
Uptrend fills are lime-toned, downtrend fills are red-toned, with adjustable opacity (gap intensity).
3. Automatic Directional Switch
When the regime flips from up → down (or vice versa), the overlay automatically switches between lower and upper bands for a clean transition.
4. Multi-Timeframe SuperTrend Table
Displays SuperTrend direction across 5m, 15m, 1h, 4h, and 1D frames.
Green ▲ = Uptrend, Red ▼ = Downtrend.
Useful for checking cross-timeframe trend alignment.
✨ How to Read It
Green SuperTrend + Lime Bands
- Uptrend regime; volatility expanding upward
Red SuperTrend + Red Bands
- Downtrend regime; volatility expanding downward
Narrow gaps (A–C)
- Low volatility / compression (potential squeeze)
Wide gaps
- High volatility / active trend phase
Opposite ST line close to price
- Early warning for regime transition
✨ Practical Use
Identify trend direction (SuperTrend color & line position).
Assess volatility conditions (band width and gap transparency).
Watch for MTF alignment: consistent up/down signals across 1h–4h–1D = strong structural trend.
Combine with momentum indicators (e.g., RSI, DFI, PCI) for confirmation of trend maturity or exhaustion.
✨ Customization Tips
ST Factor / ATR Length
- Adjust sensitivity of SuperTrend direction changes
Band ATR Length
- Controls overall smoothness of volatility envelopes
Band Multipliers (A/B/C)
- Define how wide each volatility band extends
Gap Opacity
- Affects visual contrast between layers
MTF Table
- Enable/disable multi-timeframe display
✨ Educational Value
This script visualizes the interaction between trend direction (SuperTrend) and volatility envelopes, helping traders understand how price reacts within layered ATR zones.
It also introduces a clean MTF (multi-timeframe) perspective — ideal for discretionary and system traders alike.
✨ Disclaimer
This indicator is provided for educational and research purposes only.
It does not constitute financial advice or a trading signal.
Use at your own discretion and always confirm with additional tools.
───────────────────────────────
📘 한국어 설명 (Korean translation below)
───────────────────────────────
✨개념
SuperTrend Cyan 지표는 기존의 SuperTrend를 확장하여,
추세선 분리(Split Line) + 3중 밴드 시스템(Triple Bands) 으로
시장의 구조적 흐름과 변동성 범위를 동시에 시각화합니다.
단순한 SuperTrend의 강점을 유지하면서도,
ATR 기반의 A/B/C 밴드를 통해 변동성 압축·확장 구간을 직관적으로 파악할 수 있습니다.
✨ 작동 방식
1. SuperTrend 코어 (활성/반대 라인)
ATR×Factor를 기반으로 추세선을 계산합니다.
현재 추세 방향에 따라 활성 라인이 표시되고, “Show Opposite” 옵션을 켜면 반대편 경계선도 함께 보입니다.
2. 트리플 밴드 시스템 (A/B/C)
hl2(중간값)를 기준으로 ATR 배수에 따라 세 개의 밴드를 계산합니다.
A: 외곽 밴드 (가장 넓고 장기 구조 반영)
B: 중간 밴드 (중기적 움직임)
C: 코어 밴드 (가격에 가장 근접, 단기 변동성 반영)
EMA 스무딩으로 부드럽게 조정 가능.
업트렌드 구간은 라임색, 다운트렌드는 빨간색 음영으로 표시됩니다.
3. 자동 전환 시스템
추세가 전환될 때(Up ↔ Down), 밴드 오버레이도 자동으로 교체되어 깔끔한 시각적 구조를 유지합니다.
4. MTF SuperTrend 테이블
5m / 15m / 1h / 4h / 1D 프레임별 SuperTrend 방향을 표시합니다.
초록 ▲ = 상승, 빨강 ▼ = 하락.
복수 타임프레임 정렬 확인용으로 유용합니다.
✨ 해석 방법
초록 SuperTrend + 라임 밴드
- 상승 추세 및 확장 구간
빨강 SuperTrend + 레드 밴드
- 하락 추세 및 확장 구간
밴드 폭이 좁음
- 변동성 축소 (스퀴즈)
밴드 폭이 넓음
- 변동성 확장, 추세 강화
반대선이 근접
- 추세 전환 가능성 높음
✨ 활용 방법
SuperTrend 색상으로 추세 방향을 확인
A/B/C 밴드 폭으로 변동성 수준을 판단
MTF 테이블을 통해 복수 타임프레임 정렬 여부 확인
RSI, DFI, PCI 등 다른 지표와 함께 활용 시, 추세 피로·모멘텀 변화를 조기에 파악 가능
✨ 교육적 가치
이 스크립트는 추세 구조(SuperTrend) 와 변동성 레이어(ATR Bands) 의 상호작용을
시각적으로 학습하기 위한 교육용 지표입니다.
또한, MTF 구조를 통해 시장의 “위계적 정렬(hierarchical alignment)”을 쉽게 인식할 수 있습니다.
✨ 면책
이 지표는 교육 및 연구 목적으로만 제공됩니다.
투자 판단의 책임은 사용자 본인에게 있으며, 본 지표는 매매 신호를 보장하지 않습니다.

Cycle VTLs – with Scaled Channels "Cycle VTLs – with Scaled Channels" for TradingView plots Valid Trend Lines (VTLs) based on Hurst's Cyclic Theory, connecting consecutive price peaks (downward VTLs) or troughs (upward VTLs) for specific cycles. It uses up to eight Simple Moving Averages (SMAs) (default lengths: 25, 50, 100, 200, 400, 800, 1600, 1600 bars) with customizable envelope bands to detect pivots and draw VTLs, enhanced by optional parallel channels scaled to envelope widths.
Key Features:
Valid Trend Lines (VTLs):
Upward VTLs: Connect consecutive cycle troughs, sloping upward.
Downward VTLs: Connect consecutive cycle peaks, sloping downward.
Hurst’s Rules:
Connects consecutive cycle peaks/troughs.
Must not cross price between points.
Downward VTLs:
No longer-cycle trough between peaks.
Invalid if slope is incorrect (upward VTL not up, downward VTL not down).
Expired VTLs: Historical VTLs (crossed by price) from up to three prior cycle waves.
SMA Cycles:
Eight customizable SMAs with envelope bands (offset × multiplier) for pivot detection.
Channels:
Optional parallel lines around VTLs, width set by channelFactor × envelope half-width.
Pivot Detection:
Fractal-based (pivotPeriod) on envelopes or price (usePriceFallback).
Customization:
Toggle cycles, VTLs, and channels.
Adjust SMA lengths, offsets, colors, line styles, and widths.
Enable centered envelopes, slope filtering, and limit stored lines (maxStoredLines).
Usage in Hurst’s Cyclic TheoryAnalysis:
VTLs identify cycle trends; upward VTLs suggest bullish momentum, downward VTLs bearish.
Price crossing below an upward VTL confirms a peak in the next longer cycle; crossing above a downward VTL confirms a trough.
Trading:
Buy: Price bounces off upward VTL or breaks above downward VTL.
Sell: Price rejects downward VTL or breaks below upward VTL.
Use channels for support/resistance, breakouts, or stop-loss/take-profit levels.
Workflow:
Add indicator on TradingView.
Enable desired cycles (e.g., 50-bar, 1600-bar), adjust pivotPeriod, channelFactor, and showOnlyCorrectSlope.
Monitor VTL crossings and channels for trade signals.
NotesOptimized for performance with line limits.
Ideal for cycle-based trend analysis across markets (stocks, forex, crypto).
Debug labels show pivot counts and VTL status.
This indicator supports Hurst’s Cyclic Theory for trend identification and trading decisions with flexible, cycle-based VTLs and channels.
Use global variable to scale to chart. best results use factors of 2 and double. try 2, 4, 8, 16...128, 256, etc until price action fits 95% in smallest cycle.
Hull Moving Average (Open-Close)Hull Moving Average (Open-Close) with Advanced Alerts
Overview
This indicator presents an enhanced version of the Hull Moving Average (HMA) that uses the average of open and close prices as its source calculation. It features multiple alert conditions and visual signals to help traders identify trend direction changes and potential entry points with precision.
Key Features
Unique Source Calculation: Uses (open + close)/2 instead of the typical close price, providing a balanced view of price action
Dynamic Coloring: Optional setting colors the HMA green when rising and red when declining for instant visual trend recognition
Multiple Alert Conditions:
HMA Direction Change: Alerts when the HMA changes direction
HMA Up/Down Specific Alerts: Separate alerts for upward and downward turns
Candle Body Cross: Alerts when a candle's body crosses above or below the HMA
Visual Signals: Triangle markers show HMA direction changes, and circles indicate candle body crosses
Input Parameters
Length: Period for HMA calculation (default: 9)
Dynamic Color: Toggles color-changing HMA based on direction (default: true)
Alert Conditions
HMA Up: Triggers when the HMA turns upward
HMA Down: Triggers when the HMA turns downward
HMA Direction Change: General alert for any direction change
Candle Body Cross HMA: Triggers when a full candle body crosses the HMA
Usage
Trend Identification: The HMA's slope and color indicate trend direction
Entry Signals: Candle body crosses above/below HMA may suggest potential entry points
Confirmation: Use in conjunction with other indicators for trade confirmation
Ideal For
Swing traders looking for trend direction changes
Day traders seeking precise entry signals
Price action traders who prefer open-close averaged calculations
This indicator provides a clean, customizable implementation of the Hull Moving Average with multiple alert options suitable for various trading styles.
Note: This is a technical analysis tool and should be used as part of a comprehensive trading strategy. Always practice risk management.
Advanced Volume Profile Pro Delta + POC + VAH/VAL# Advanced Volume Profile Pro - Delta + POC + VAH/VAL Analysis System
## WHAT THIS SCRIPT DOES
This script creates a comprehensive volume profile analysis system that combines traditional volume-at-price distribution with delta volume calculations, Point of Control (POC) identification, and Value Area (VAH/VAL) analysis. Unlike standard volume indicators that show only total volume over time, this script analyzes volume distribution across price levels and estimates buying vs selling pressure using multiple calculation methods to provide deeper market structure insights.
## WHY THIS COMBINATION IS ORIGINAL AND USEFUL
**The Problem Solved:** Traditional volume indicators show when volume occurs but not where price finds acceptance or rejection. Standalone volume profiles lack directional bias information, while basic delta calculations don't provide structural context. Traders need to understand both volume distribution AND directional sentiment at key price levels.
**The Solution:** This script implements an integrated approach that:
- Maps volume distribution across price levels using configurable row density
- Estimates delta (buying vs selling pressure) using three different methodologies
- Identifies Point of Control (highest volume price level) for key support/resistance
- Calculates Value Area boundaries where 70% of volume traded
- Provides real-time alerts for key level interactions and volume imbalances
**Unique Features:**
1. **Developing POC Visualization**: Real-time tracking of Point of Control migration throughout the session via blue dotted trail, revealing institutional accumulation/distribution patterns before they complete
2. **Multi-Method Delta Calculation**: Price Action-based, Bid/Ask estimation, and Cumulative methods for different market conditions
3. **Adaptive Timeframe System**: Auto-adjusts calculation parameters based on chart timeframe for optimal performance
4. **Flexible Profile Types**: N Bars Back (precise control), Days Back (calendar-based), and Session-based analysis modes
5. **Advanced Imbalance Detection**: Identifies and highlights significant buying/selling imbalances with configurable thresholds
6. **Comprehensive Alert System**: Monitors POC touches, Value Area entry/exit, and major volume imbalances
## HOW THE SCRIPT WORKS TECHNICALLY
### Core Volume Profile Methodology:
**1. Price Level Distribution:**
- Divides price range into user-defined rows (10-50 configurable)
- Calculates row height: `(Highest Price - Lowest Price) / Number of Rows`
- Distributes each bar's volume across price levels it touched proportionally
**2. Delta Volume Calculation Methods:**
**Price Action Method:**
```
Price Range = High - Low
Buy Pressure = (Close - Low) / Price Range
Sell Pressure = (High - Close) / Price Range
Buy Volume = Total Volume × Buy Pressure
Sell Volume = Total Volume × Sell Pressure
Delta = Buy Volume - Sell Volume
```
**Bid/Ask Estimation Method:**
```
Average Price = (High + Low + Close) / 3
Buy Volume = Close > Average ? Volume × 0.6 : Volume × 0.4
Sell Volume = Total Volume - Buy Volume
```
**Cumulative Method:**
```
Buy Volume = Close > Open ? Volume : Volume × 0.3
Sell Volume = Close ≤ Open ? Volume : Volume × 0.3
```
**3. Point of Control (POC) Identification:**
- Scans all price levels to find maximum volume concentration
- POC represents the price level with highest trading activity
- Acts as significant support/resistance level
- **Developing POC Feature**: Tracks POC evolution in real-time via blue dotted trail, showing how institutional interest migrates throughout the session. Upward POC migration indicates accumulation patterns, downward migration suggests distribution, providing early trend signals before price confirmation.
**4. Value Area Calculation:**
- Starts from POC and expands up/down to encompass 70% of total volume
- VAH (Value Area High): Upper boundary of value area
- VAL (Value Area Low): Lower boundary of value area
- Expansion algorithm prioritizes direction with higher volume
**5. Adaptive Range Selection:**
Based on profile type and timeframe optimization:
- **N Bars Back**: Fixed lookback period with performance optimization (20-500 bars)
- **Days Back**: Calendar-based analysis with automatic timeframe adjustment (1-365 days)
- **Session**: Current trading session or custom session times
### Performance Optimization Features:
- **Sampling Algorithm**: Reduces calculation load on large datasets while maintaining accuracy
- **Memory Management**: Clears previous drawings to prevent performance degradation
- **Safety Constraints**: Prevents excessive memory usage with configurable limits
## HOW TO USE THIS SCRIPT
### Initial Setup:
1. **Profile Configuration**: Select profile type based on trading style:
- N Bars Back: Precise control over data range
- Days Back: Intuitive calendar-based analysis
- Session: Real-time session development
2. **Row Density**: Set number of rows (30 default) - more rows = higher resolution, slower performance
3. **Delta Method**: Choose calculation method based on market type:
- Price Action: Best for trending markets
- Bid/Ask Estimate: Good for ranging markets
- Cumulative: Smoothed approach for volatile markets
4. **Visual Settings**: Configure colors, position (left/right), and display options
### Reading the Profile:
**Volume Bars:**
- **Length**: Represents relative volume at that price level
- **Color**: Green = net buying pressure, Red = net selling pressure
- **Intensity**: Darker colors indicate volume imbalances above threshold
**Key Levels:**
- **POC (Blue Line)**: Highest volume price - major support/resistance
- **VAH (Purple Dashed)**: Value Area High - upper boundary of fair value
- **VAL (Orange Dashed)**: Value Area Low - lower boundary of fair value
- **Value Area Fill**: Shaded region showing main trading range
**Developing POC Trail:**
- **Blue Dotted Lines**: Show real-time POC evolution throughout the session
- **Migration Patterns**: Upward trail indicates bullish accumulation, downward trail suggests bearish distribution
- **Early Signals**: POC movement often precedes price movement, providing advance warning of institutional activity
- **Institutional Footprints**: Reveals where smart money concentrated volume before final POC establishment
### Trading Applications:
**Support/Resistance Analysis:**
- POC acts as magnetic price level - expect reactions
- VAH/VAL provide intermediate support/resistance levels
- Profile edges show areas of low volume acceptance
**Developing POC Analysis:**
- **Upward Migration**: POC moving higher = institutional accumulation, bullish bias
- **Downward Migration**: POC moving lower = institutional distribution, bearish bias
- **Stable POC**: Tight clustering = balanced market, range-bound conditions
- **Early Trend Detection**: POC direction change often precedes price breakouts
**Entry Strategies:**
- Buy at VAL with POC as target (in uptrends)
- Sell at VAH with POC as target (in downtrends)
- Breakout plays above/below profile extremes
**Volume Imbalance Trading:**
- Strong buying imbalance (>60% threshold) suggests continued upward pressure
- Strong selling imbalance suggests continued downward pressure
- Imbalances near key levels provide high-probability setups
**Multi-Timeframe Context:**
- Use higher timeframe profiles for major levels
- Lower timeframe profiles for precise entries
- Session profiles for intraday trading structure
## SCRIPT SETTINGS EXPLANATION
### Volume Profile Settings:
- **Profile Type**: Determines data range for calculation
- N Bars Back: Exact number of bars (20-500 range)
- Days Back: Calendar days with timeframe adaptation (1-365 days)
- Session: Trading session-based (intraday focus)
- **Number of Rows**: Profile resolution (10-50 range)
- **Profile Width**: Visual width as chart percentage (10-50%)
- **Value Area %**: Volume percentage for VA calculation (50-90%, 70% standard)
- **Auto-Adjust**: Automatically optimizes for different timeframes
### Delta Volume Settings:
- **Show Delta Volume**: Enable/disable delta calculations
- **Delta Calculation Method**: Choose methodology based on market conditions
- **Highlight Imbalances**: Visual emphasis for significant volume imbalances
- **Imbalance Threshold**: Percentage for imbalance detection (50-90%)
### Session Settings:
- **Session Type**: Daily, Weekly, Monthly, or Custom periods
- **Custom Session Time**: Define specific trading hours
- **Previous Sessions**: Number of historical sessions to display
### Days Back Settings:
- **Lookback Days**: Number of calendar days to analyze (1-365)
- **Automatic Calculation**: Script automatically converts days to bars based on timeframe:
- Intraday: Accounts for 6.5 trading hours per day
- Daily: 1 bar per day
- Weekly/Monthly: Proportional adjustment
### N Bars Back Settings:
- **Lookback Bars**: Exact number of bars to analyze (20-500)
- **Precise Control**: Best for systematic analysis and backtesting
### Visual Customization:
- **Colors**: Bullish (green), Bearish (red), and level colors
- **Profile Position**: Left or Right side of chart
- **Profile Offset**: Distance from current price action
- **Labels**: Show/hide level labels and values
- **Smooth Profile Bars**: Enhanced visual appearance
### Alert Configuration:
- **POC Touch**: Alerts when price interacts with Point of Control
- **VA Entry/Exit**: Alerts for Value Area boundary interactions
- **Major Imbalance**: Alerts for significant volume imbalances
## VISUAL FEATURES
### Profile Display:
- **Horizontal Bars**: Volume distribution across price levels
- **Color Coding**: Delta-based coloring for directional bias
- **Smooth Rendering**: Optional smoothing for cleaner appearance
- **Transparency**: Configurable opacity for chart readability
### Level Lines:
- **POC**: Solid blue line with optional label
- **VAH/VAL**: Dashed colored lines with value displays
- **Extension**: Lines extend across relevant time periods
- **Value Area Fill**: Optional shaded region between VAH/VAL
### Information Table:
- **Current Values**: Real-time POC, VAH, VAL prices
- **VA Range**: Value Area width calculation
- **Positioning**: Multiple table positions available
- **Text Sizing**: Adjustable for different screen sizes
## IMPORTANT USAGE NOTES
**Realistic Expectations:**
- Volume profile analysis provides structural context, not trading signals
- Delta calculations are estimations based on price action, not actual order flow
- Past volume distribution does not guarantee future price behavior
- Combine with other analysis methods for comprehensive market view
**Best Practices:**
- Use appropriate profile types for your trading style:
- Day Trading: Session or Days Back (1-5 days)
- Swing Trading: Days Back (10-30 days) or N Bars Back
- Position Trading: Days Back (60-180 days)
- Consider market context (trending vs ranging conditions)
- Verify key levels with additional technical analysis
- Monitor profile development for changing market structure
**Performance Considerations:**
- Higher row counts increase calculation complexity
- Large lookback periods may affect chart performance
- Auto-adjust feature optimizes for most use cases
- Consider using session profiles for intraday efficiency
**Limitations:**
- Delta calculations are estimations, not actual transaction data
- Profile accuracy depends on available price/volume history
- Effectiveness varies across different instruments and market conditions
- Requires understanding of volume profile concepts for optimal use
**Data Requirements:**
- Requires volume data for accurate calculations
- Works best on liquid instruments with consistent volume
- May be less effective on very low volume or exotic instruments
This script serves as a comprehensive volume analysis tool for traders who need detailed market structure information with integrated directional bias analysis and real-time POC development tracking for informed trading decisions.

Adaptive Candle Signals█ OVERVIEW
The Adaptive Candle Signals indicator is a Pine Script® tool designed to identify key candlestick patterns on the chart, such as Bullish Engulfing, Bearish Engulfing, Piercing Line, Dark Cloud Cover, Morning Star, Evening Star, Three White Soldiers, Three Black Crows, and Three Inside Up/Down. The indicator allows customization of settings, including a Moving Average (MA) filter, candle size control, and maximum wick percentage, enabling precise adaptation to various trading strategies. Signals are displayed as labels on the chart, and each pattern can trigger alerts for user convenience.
█ CONCEPTS
The indicator is designed with flexibility and readability in mind. Its main features include:
Features
Signal Filtering: Enables the use of a Moving Average (MA) filter to confirm signals based on trend direction. Bullish signals are generated when the price is above the MA, and bearish signals when below.
Pattern Customization: Users can enable or disable individual candlestick patterns and adjust their parameters, such as maximum wick percentage or candle size multiplier. The candle size multiplier applies to the largest candle in the pattern and determines its minimum size relative to the average candle body size over a specified volatility period.
Labels and Colors: Signals are displayed as clear labels with customizable colors for bullish and bearish patterns.
Alerts: Each pattern has a dedicated alert function, facilitating integration with automated trading strategies.
List of Patterns
The indicator recognizes the following candlestick patterns (labels displayed in parentheses):
Bullish Engulfing (BE): Signals a potential upward reversal after a downtrend.
Bearish Engulfing (BE): Indicates a possible downward reversal after an uptrend.
Piercing Line (PL): A bullish pattern suggesting a bounce from support.
Dark Cloud Cover (DC): A bearish pattern indicating a potential downward reversal.
Morning Star (MS): A three-candle bullish pattern signaling an upward reversal.
Evening Star (ES): A three-candle bearish pattern indicating a downward reversal.
Three White Soldiers (3WS): A strong bullish signal based on three large bullish candles.
Three Black Crows (3BC): A strong bearish signal based on three large bearish candles.
Three Inside Up/Down (3Up/3Dn): Patterns indicating trend reversal based on an inside bar structure.
Settings
Settings are organized as follows:
MA Filter: Allows enabling a Moving Average (SMA, EMA, WMA) to filter signals based on trend direction.
Pattern Parameters: Each pattern has its own settings, such as volatility period, candle size multiplier, and maximum wick percentage. The size of the largest candle in the pattern is compared to the average candle body size over the specified volatility period.
Colors and Labels: Users can customize label colors and their distance from candles to improve readability.
█ SETTINGS
Detailed description of the indicator’s settings:
MA Filter:
Use MA Filter: Enables/disables the Moving Average filter.
MA Length: Specifies the period of the Moving Average (default: 50).
MA Type: Choose between SMA, EMA, or WMA.
MA Source: Select the data source (default: close price).
Pattern Settings:
Enable Pattern: Checkbox for each pattern (e.g., Bullish Engulfing, Morning Star).
Maximum Wick Percentage: Defines the maximum allowable wick size as a percentage of the candle body.
Big Candle Filter: Enables/disables checking if the largest candle in the pattern is larger than the average over the specified volatility period.
Volatility Period: Sets the period for calculating the average candle body size.
Candle Multiplier: Multiplier determining the minimum size of the largest candle in the pattern relative to the average candle body size over the specified volatility period.
Appearance:
Signal Text Color: Color of the label text (default: white).
Bullish Label Color: Color for bullish signals (default: green).
Bearish Label Color: Color for bearish signals (default: red).
Label Offset Factor: Controls the distance of labels from candles (from 0.0 to 1.0).
█ HOW TO USE
Add the indicator to your TradingView chart.
Configure the settings in the indicator’s dialog box:
Enable desired candlestick patterns.
Adjust the MA filter parameters to restrict signals to the trend.
Set colors and label offset for better readability.
Enable alerts for selected patterns to receive real-time notifications.
Monitor the labels on the chart and use them alongside other technical analysis tools.
█ LIMITATIONS
The indicator relies on historical price data and may produce false signals in volatile market conditions.
The big candle filter may be less effective on charts with low volatility.
The indicator performs best when combined with other analysis methods, such as support and resistance levels.
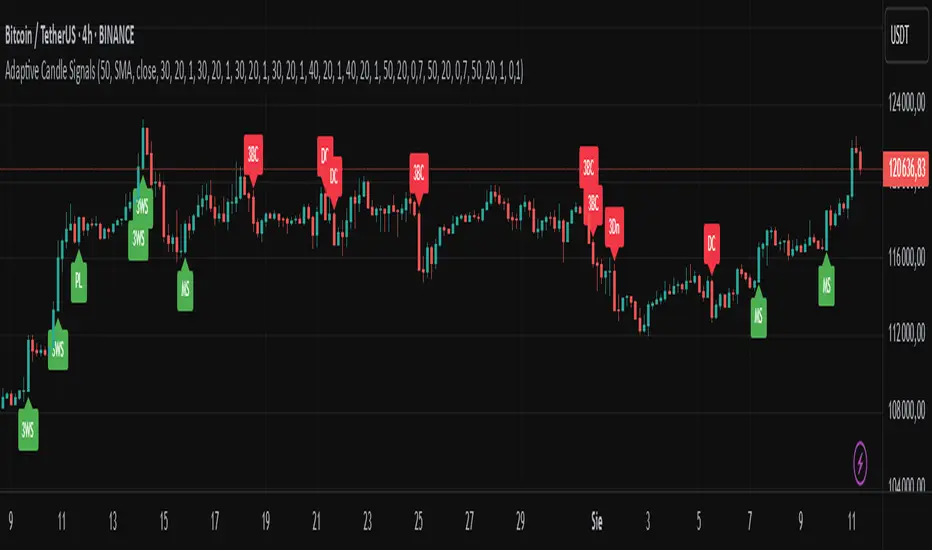
ZenAlgo - DeltaThis indicator visualizes cumulative delta volume across multiple exchanges and trading pairs, with optional moving averages, divergence detection, and contextual labeling. It aggregates buy and sell volume from both spot and perpetual markets, applying normalization and visual encoding to highlight volume flow dynamics over time.
Volume Aggregation Logic
The script starts by collecting volume data from up to nine exchanges. It distinguishes between spot (e.g., USDT, USD) and perpetual markets (e.g., USDT.P, USD.P) using dynamically constructed tickers based on the asset's base currency. For each enabled exchange, it fetches volume using request.security , filtering out invalid or zero-volume responses.
Each set of volume data (spot1, spot2, perp1, perp2) is then processed through a reducer function that combines the values using a selected method—sum, average, median, or variance. These processed volumes are further categorized and summed into total spot and perp volume streams, forming the basis for downstream delta computations.
Delta Calculation
For each bar, the script decomposes the candlestick into wick and body proportions, calculating how much of the total volume might be attributed to upward or downward pressure. This estimation weights the volume by the visual structure of the candle—larger bodies and upper wicks in bullish candles suggest buying pressure; inverse logic applies for bearish candles.
These estimated buy and sell volumes are then subtracted to derive per-bar delta. A cumulative delta series is computed by summing this bar-by-bar delta across a user-defined window length.
Divergences on Delta
Fractal logic is applied to detect local highs and lows in the cumulative delta series. These points serve as anchors for divergence comparisons:
Regular divergences identify price making higher highs (or lower lows) while delta makes lower highs (or higher lows).
Hidden divergences look for the opposite (price pullback vs delta continuation).
The same logic is applied independently to:
Raw cumulative delta
A primary delta moving average
A secondary, slower moving average
Each can be configured with different lookback lengths and moving average types (SMA, EMA, WMA, HMA, RMA).
The divergence logic gains additional value when used in tandem with the delta moving averages and contextual temperature state. For example, a divergence detected on the slower delta average while the temperature band is in an “Extreme Hot” or “Cold” zone may indicate a more meaningful exhaustion event. This layered approach allows users to filter weaker divergences and focus on those that align with broader delta context.
Gradient and Temperature Context
A third moving average (e.g., WMA(50)) is used to provide a contextual "temperature" state of the delta environment. Based on deviations from its own mean and standard deviation, this third MA is classified into zones:
"Extreme Hot", "Hot", "Warm"
"Neutral"
"Cool", "Cold", "Extreme Cold"
These zones are encoded using color and transparency gradients in the chart’s background. This helps identify periods where delta conditions are statistically stretched or compressed relative to recent history.
EMA Cross Conditions
The script tracks crossover events between the short and long EMAs of delta, especially when these align with a directional shift in cumulative delta (e.g., zero-line cross). If confirmed by volume skew (more buy than sell or vice versa), specific visual markers are plotted.
Labels and Informational Lines
Dynamic labels are rendered on the latest bar showing:
Cumulative delta and last divergence
EMA values and associated divergence
"Slow MA" value and its temperature state
These labels float next to the latest values, using thematic or neutral colors based on user preference.
Buy/Sell Pressure Tables
Two optional tables display breakdowns of:
Buy vs Sell volume
Their percentage contribution
Net delta value
Market condition label (e.g., "Full Bull", "Bearish")
These are calculated over the selected lookback period and color-coded accordingly.
An experimental table compares raw and aggregated spot/perpetual volume contributions and their percentage skew.
Background Highlight Logic
Background colors are conditionally rendered based on buy/sell volume dominance. Several thresholds exist:
2x or 3x buy volume dominance → greenish tones
2x or 3x sell volume dominance → reddish tones
Combined with temperature overlays, this highlights areas of potentially high conviction from either side.
Cross Conditions
The script detects situations where cumulative delta crosses under buy/sell volume thresholds. Visual dots mark:
Negative delta intersecting rising sell volume
Positive delta intersecting rising buy volume
This provides additional cues when short-term volume shifts might contradict recent cumulative flow.
How to Interpret Values
Cumulative Delta (AggDelta): Tracks net buy vs sell pressure over time. A rising delta suggests persistent buying pressure, and vice versa.
Temperature State: Places delta flow into historical context. “Extreme Hot” implies sustained positive flow, possibly overextended; “Cold” signals inverse.
EMA Lines: Short- and long-term smoothing of delta for trend and divergence detection.
Cross Events: Represent moments when short EMA crosses over delta or long EMA, often signaling a directional momentum change.
Tables and Labels: Quantify volume dominance and flow state, helping assess if flow aligns with price structure.
How to Best Use
For context: Observe overall slope and temperature of the third MA. High deviations often precede cooling or reversal.
For confluence: Look for alignment between price structure (e.g., higher highs) and delta divergence to identify exhaustion or continuation.
For short-term timing: Watch EMA crosses and volume conditions (e.g., buy volume increasing while delta crosses above zero).
Added Value Compared to Other Free Indicators
Multi-exchange Aggregation: Includes spot and perp data across major exchanges with flexible inclusion settings.
Granular Delta Estimation: Uses candle body/wick proportions rather than simple up/down tick assumptions.
Context-Aware Visualization: Integrates volume gradient, statistical deviation zones, and divergence overlays in one compact view.
Highly Customizable: Users can fine-tune divergence, moving average, color scheme, and table display independently.
Integrated View with Synergistic Logic: Unlike using several isolated scripts, this indicator unifies delta flow, divergence, volume dominance, and statistical context into one coherent framework. This synergy reduces the need to reconcile signals from different sources and allows for clearer judgment when multiple conditions align.
Limitations and Disclaimers
Delta Approximation: Calculated using heuristic candle shape assumptions; not a tick-level order book delta.
Exchange Coverage: Relies on availability of correct tickers and historical volume data via TradingView’s request.security .
Visual Lag: Cumulative delta and divergence patterns may develop over several bars and are not predictive on their own.
No Entry Signals: This indicator does not provide trading signals, nor does it evaluate risk or price targets.
Additional Limitations
This indicator estimates delta from candle shape and volume distribution heuristics. In low-liquidity markets or on lower timeframes, this estimation may misrepresent actual flow dynamics, especially during volatile spikes or news-driven moves. Divergence patterns may appear with delay or persist without price reaction, particularly in ranging or algorithmically driven markets. Users should combine these tools with broader context and price action awareness rather than relying on isolated delta events.

Trend Strength Oscillator📌 What Is the Trend Strength Oscillator?
The Trend Strength Oscillator is a visual tool that helps traders understand the overall direction and strength of the market trend. Instead of using multiple indicators separately, this tool combines three trusted methods into one clear, color-coded bar chart. The bars change based on whether the market is strongly trending up, down, or just moving sideways.
Imagine it as a traffic light for trading:
• Green means it’s safe to consider buying (strong uptrend).
• Red means consider selling or avoiding longs (strong downtrend).
• Gray means wait, the market isn’t clearly trending.
🧠 How It Works — The 3 Main Components
1. EMA Slope
The EMA (Exponential Moving Average) tracks the average price but reacts more quickly to changes. If the EMA is rising, it means the market is likely moving upward. If it’s falling, the trend is likely downward.
2. RSI Direction
RSI (Relative Strength Index) measures momentum. This tool compares the RSI to its smoothed average. If the RSI is above its average, momentum is up. If it’s below, momentum is down.
3. ADX Strength
ADX (Average Directional Index) measures how strong a trend is, not the direction. So even if EMA and RSI agree on a trend, the ADX must confirm it’s strong enough to be worth trading.
Only when all three indicators agree do we consider it a strong trend.
🧮 What the Oscillator Shows
The result of combining those components is a number that becomes a colored bar:
• +2 means all three signals are bullish → green bar.
• -2 means all three signals are bearish → red bar.
• Anything else (e.g., mixed signals or weak ADX) → gray bar.
This makes the chart super easy to read at a glance, even for beginners.
📈 How to Use It in Trading
You can use the Trend Strength Oscillator in a few simple ways:
• Entering Trades:
Look for a green bar when you want to buy or go long. Look for a red bar when you want to sell or go short. These bars mean all systems are “go” in the same direction.
• Avoiding Mistakes:
If the bar is gray, it’s a warning that the market is undecided or weak. It’s often better to wait for a clearer signal rather than force a trade.
• Managing Existing Trades:
If you’re in a trade and the bar color shifts back to gray, that can be a clue that the trend is losing strength. You might tighten your stop-loss or take some profit.
🧭 Final Thoughts
This indicator doesn’t give you a trade entry every few minutes. Instead, it helps you stay on the right side of strong moves and avoid choppy or sideways markets. It’s especially helpful for:
• Trend-following traders
• People who want clean, simple visuals
• Beginners who get overwhelmed with too many indicators
Let me know if you'd like to see this paired with another tool like volume or MACD, or if you’d like a chart screenshot to visualize how this looks live.
MA Thrust Processor | QuantEdgeB⚡MA Thrust Processor | QuantEdgeB
🔭 What is the MA Thrust Processor?
The MA Thrust Processor (MTP) is a dynamic and modular market momentum engine that specializes in thrust-based signal analysis derived from smoothed moving averages. It’s engineered to model directional commitment, detect signal imbalances, and visualize structural momentum in a range of market conditions.
🧬 Think of MTP as a precision-engineered motion sensor — decoding strength, follow-through, and structural imbalance in real time — it detects force, direction, velocity, and alignment, adapting based on your preferred calculation model (Wave, Thrust, Z-Score, or Normalized) and signal mode (Impulse, Trend, or HA Candles).
_______________________
1. 🔧 System Core: Customizability and Processing Engine
📊 Moving Average Types
MA Thrust Processor supports a rich menu of 13+ moving average styles:
• Standard: SMA, EMA, WMA
• Advanced: HMA, LSMA, ALMA, JMA, TEMA, DEMA, SMMA
• Volume-Based: VWMA
• Adaptive Models: VIDYA (3 modes), FRAMA
💡 Each MA type acts as the backbone for signal smoothing and thrust deviation modeling, giving the user tight control over behavior and lag tradeoffs.
⚙️ Calculation Methods (MA Derivatives)
You choose how the core value is calculated:
1️⃣ 𝓦𝓪𝓿𝓮
• Sine-wave modeled oscillator
• Combines MA distance with standard deviation normalization
• Ideal for detecting divergences and cyclical structure
• Output includes center, smoothed line , and histogram.
2️⃣ 𝓣𝓱𝓻𝓾𝓼𝓽
• Calculates MA deviation vs. price and midpoint
• Captures aggressive directional pushes relative to range center
• Excellent for breakout/trend force analysis
3️⃣ 𝓩-𝓢𝓬𝓸𝓻𝓮
• Mean-reverting z-score over MA
• Expresses statistical distance from norm
• Used in reversion or probabilistic strategies
4️⃣ 𝓝𝓸𝓻𝓶𝓪𝓵𝓲𝔃𝓮𝓭
• Scales MA output to 0–1 (centered at 0.5)
• Tracks where the signal lies in its own relative range
• Great for flat vs. trending recognition
_______________________
2. 🧨 SIGNAL MODES – The Behavioral Core
The system supports 3 powerful signal modes that define how the thrust logic is interpreted and visualized.
1️⃣ 𝓘𝓶𝓹𝓾𝓵𝓼𝓮 Mode
🔥 Use Case: Breakouts, aggressive reversals, divergences
🔍 Logic:
• In Wave mode: compares Wave O (oscillator) and S (smoothed)
• In Thrust/Z-Score/Normalized: applies thresholds (static, SD, or percentile)
• Detects sharp departures or rejections from bounds
🎯 Ideal for:
• Scalp or event trades
• High-velocity moves
• Leading edge of trend or compression breaks
2️⃣ 𝓣𝓻𝓮𝓷𝓭 Mode
🧭 Use Case: Stable continuation and trend following
🔍 Logic:
• Signal triggers when value crosses a calculated midline or long-term average
• Thresholds: midline or 365-SMA of smoothed value
• Acts as a stable “bias direction” for trades
🎯 Ideal for:
• Swing trading
• Portfolio allocations
• Holding directional exposure longer
3️⃣ 𝓗𝓐 𝓒𝓪𝓷𝓭𝓵𝓮𝓼 Mode
🎨 Use Case: Visual clarity + phase detection
🔍 Logic:
• Converts signal to Heikin-Ashi candles
• Adds logic for momentum, reversal, continuation, or chop
• Highly discretionary and pattern-oriented
🎯 Ideal for:
• Visual traders
• Phase-based strategies
• Avoiding false positives in chop
_______________________
3. 📊 System Sensor Table (Strength Meter)
MA Thrust Processor includes a sophisticated sensor display with multi-layered insights.
🔁 Signal State
• Long ⟹ bullish conviction or thrust
• Short ⟹ bearish dominance or rejection
• Cash ⟹ neutrality or low conviction
Dynamically generated by logic mode and indicator thresholds.
📊 Strength Bars: Conviction + Potential
Strength output is never binary — instead, it’s expressed via:
1️⃣ Conviction Strength (when signal is active):
• Score from 0% to 100%
• Based on:
o Momentum velocity (Rate of Change)
o Distance from key thresholds
o Divergence signal (Wave mode)
o Flat signal detection (for Normalized)
2️⃣ Potential Strength (when signal = neutral):
• Displays both Bullish and Bearish readiness
• Interprets which side is loading pressure
• Helps traders spot “who has the edge” before breakout
👀 In Wave Mode, potential is calculated from oscillator vs. smoothed
👀 In Impulse/Trend, it blends distance + RoC + signal stability
🔸 HA Candle Phase (HA Mode Only)
When HA mode is active, strength bars are replaced with a live phase classifier:
• Momentum Up/Down: price above/below threshold + same color trend
• Reversal Up/Down: price above/below bounds, opposite signal color
• Continuation Up/Down: following a breakout/confirmation
• Chop: indecision zone
• Neutral: no clear trend
This turns HA mode into a narrative engine, expressing what’s happening, why, and what might come next.
_______________________
4. 🧠 Smart Auto-Configuration
Enabling Use Recommended Settings triggers optimized configurations:
• Pre-set thresholds (static, percentile, SD)
• Ideal lengths for each logic type
• Proper bounds scaling
• MA selections that match the logic
For example:
• Impulse + Thrust ⇒ shorter length + SD
• Trend + Z-Score ⇒ long mean-based
• Wave ⇒ balanced smoothing + SD blend
_______________________
5. 🧪 Summary of Use Cases
Each mode and calculation method within the MA Thrust Processor is tailored for specific trading styles and market conditions. Here’s how to think about their best applications:
🔹 Signal Modes
Impulse Mode is designed for speed and responsiveness. It excels in fast markets where breakouts or sharp reversals happen quickly. Ideal for scalpers, intraday traders, or anyone looking to catch momentum just as it ignites. It’s particularly effective around high-impact events like economic reports or news catalysts, as it picks up directional shifts rapidly.
Trend Mode focuses on longer-term, stable price action. It identifies directional bias using midline or average-based thresholds, making it best for swing traders and trend followers. Because of its stability, it filters out minor fluctuations and helps you stay in trades longer when the directional move is sustained.
HA Candles Mode is for traders who prefer a visual, phase-based approach. It smooths data using Heikin-Ashi logic and adds interpretive layers like "Momentum," "Reversal," or "Chop" to describe what’s happening structurally. This is excellent for discretionary traders, those who use price rhythm or structure, and those seeking cleaner entry points in noisy environments.
🔹 Calculation Methods
Wave is an oscillator-based model. It detects momentum swings and divergence between price and the smoothed oscillator. Great for spotting early reversals, pullback continuations, or cyclical rhythm patterns. In Impulse mode, it shows histogram shifts that reflect internal thrust dynamics.
Thrust quantifies directional pressure by comparing the signal’s distance from both the midpoint of price range and an SMA. This method is powerful when you want to assess how much true force is behind a move — especially useful during breakout scenarios or strong directional pushes.
Z-Score mode normalizes the signal to its statistical distance from the mean. This makes it ideal for mean reversion strategies or situations where price has deviated too far from historical behavior. Traders can look for exhaustion zones or pullback opportunities with greater confidence.
Normalized rescales the signal within a 0–1 range (centered at 0.5), helping traders understand where the price sits within its own context — whether it’s relatively extended or compressed. It’s great for range traders, flat market identification, or mapping gradual bias accumulation.
_______________________
Each mode and method has been thoughtfully designed to align with different strategy frameworks — and switching between them completely reconfigures the way the system operates, giving traders unmatched flexibility across timeframes and asset classes
_______________________
🧭 Conclusion
MA Thrust Processor isn’t just a tool - it’s a precision-calibrated thrust engine that gives market context form. It lets you define your logic, style, and MA behavior while delivering rich visual output and conviction-based strength insight.
Whether you're reading momentum waves, modeling thrust deviation, or interpreting candle structure, MTP adapts to your strategy.
🚀 From short-term scalps to long-term rotations, MTP delivers signal clarity with the quantitative conviction needed in modern markets.
📌 Trade with Statistical Precision | Powered by QuantEdgeB
🔹 Disclaimer: Past performance is not indicative of future results.
🔹 Strategic Advice: Always backtest, optimize, and align parameters with your trading objectives and risk tolerance before live trading.

AllMA Trend Radar [trade_lexx]📈 AllMA Trend Radar is your universal trend analysis tool!
📊 What is AllMA Trend Radar?
AllMA Trend Radar is a powerful indicator that uses various types of Moving Averages (MA) to analyze trends and generate trading signals. The indicator allows you to choose from more than 30 different types of moving averages and adjust their parameters to suit your trading style.
💡 The main components of the indicator
📈 Fast and slow moving averages
The indicator uses two main lines:
- Fast MA (blue line): reacts faster to price changes
- Slow MA (red line): smoother, reflects a long-term trend
The combined use of fast and slow MA allows you to get trend confirmation and entry/exit points from the market.
🔄 Wide range of moving averages
There are more than 30 types of moving averages at your disposal:
- SMA: Simple moving average
- EMA: Exponential moving average
- WMA: Weighted moving average
- DEMA: double exponential MA
- TEMA: triple exponential MA
- HMA: Hull Moving Average
- LSMA: Moving average of least squares
- JMA: Eureka Moving Average
- ALMA: Arnaud Legoux Moving Average
- ZLEMA: moving average with zero delay
- And many others!
🔍 Indicator signals
1️⃣ Fast 🆚 Slow MA signals (intersection and ratio of fast and slow MA)
Up/Down signals (intersection)
- Buy (Up) signal:
- What happens: the fast MA crosses the slow MA from bottom to top
- What does the green triangle with the "Buy" label under the candle look
like - What does it mean: a likely upward trend reversal or an uptrend strengthening
- Sell signal (Down):
- What happens: the fast MA crosses the slow MA from top to bottom
- What does it look like: a red triangle with a "Sell" mark above the candle
- What does it mean: a likely downtrend reversal or an increase in the downtrend
Greater/Less signals (ratio)
- Buy signal (Greater):
- What happens: the fast MA becomes higher than the slow MA
- What does it look like: a green triangle with a "Buy" label under the candle
- What does it mean: the formation or confirmation of an uptrend
- Sell signal (Less):
- What happens: the fast MA becomes lower than the slow MA
- What does it look like: a red triangle with a "Sell" mark above the candle
- What does it mean: the formation or confirmation of a downtrend
2️⃣ Signals ⚡️ Fast MA (fast MA and price)
Up/Down signals (intersection)
- Buy signal (Up Fast):
- What happens: the price crosses the fast MA from bottom to top
- What does it look like: a green triangle with a "Buy" label under the candle
- What does it mean: a short-term price growth signal
- Sell signal (Down Fast):
- What happens: the price crosses the fast MA from top to bottom
- What does it look like: a red triangle with a "Sell" label above the candle
- What does it mean: a short-term price drop signal
Greater/Less signals (ratio)
- Buy signal (Greater Fast):
- What happens: the price is getting higher than the fast MA
- What does it look like: a green triangle with a "Buy" label under the candle
- What does it mean: the price is above the fast MA, which indicates an upward movement
- Sell signal (Less Fast):
- What happens: the price is getting lower than the fast MA
- What does it look like: a red triangle with a "Sell" mark above the candle
- What does it mean: the price is under the fast MA, which indicates a downward movement
3️⃣ Signals 🐢 Slow MA (slow MA and price)
Up/Down signals (intersection)
- Buy signal (Up Slow):
- What happens: the price crosses the slow MA from bottom to top
- What does it look like: a green triangle with a "Buy" label under the candle
- What does it mean: a potential medium-term upward trend reversal
- Sell signal (Down Slow):
- What happens: the price crosses the slow MA from top to bottom
- What does it look like: a red triangle with a "Sell" label above the candle
- What does it mean: a potential medium-term downward trend reversal
Greater/Less signals (ratio)
- Buy signal (Greater Slow):
- What happens: the price is getting above the slow MA
- What does it look like: a green triangle with a "Buy" label under the candle
- What does it mean: the price is above the slow MA, which indicates a strong upward movement
- Sell signal (Less Slow):
- What is happening: the price is getting below the slow MA
- What does it look like: a red triangle with a "Sell" mark above the candle
- What does it mean: the price is under the slow MA, which indicates a strong downward movement
🛠 Filters to filter out false signals
1️⃣ Minimum distance between the signals
- What it does: sets the minimum number of candles between signals of the same type
- Why it is needed: it prevents the appearance of too frequent signals, especially during periods of high volatility
- How to set it up: Set a different value for each signal type (default: 3-5 bars)
- Example: if the value is 3 for Up/Down signals, after the buy signal appears, the next buy signal may appear no earlier than 3 bars later
2️⃣ Advanced indicator filters
🔍 RSI Filter
- What it does: Checks the Relative Strength Index (RSI) value before generating a signal
- Why it is needed: it helps to avoid countertrend entries and catch reversal points
- How to set up:
- For buy signals (🔋 Buy): set the RSI range, usually in the oversold zone (for example, 1-30)
- For sell signals (🪫 Sell): set the RSI range, usually in the overbought zone (for example, 70-100)
- Example: if the RSI = 25 (in the range 1-30), the buy signal will be confirmed
📊 MFI Filter (Cash Flow Index)
- What it does: analyzes volumes and the direction of price movement
- Why it is needed: confirms signals with data on the activity of cash flows
- How to set up:
- For buy signals (🔋 Buy): set the MFI range in the oversold zone (for example, 1-25)
- For sell signals (🪫 Sell): set the MFI range in the overbought zone (for example, 75-100)
- Example: if MFI = 80 (in the range of 75-100), the sell signal will be confirmed
📈 Stochastic Filter
- What it does: analyzes the position of the current price relative to the price range
- Why it is needed: confirms signals based on overbought/oversold conditions
- How to configure:
- You can configure the K Length, D Length and Smoothing parameters
- For buy signals (🔋 Buy): set the stochastic range in the oversold zone (for example, 1-20)
- For sell signals (🪫 Sell): set the stochastic range in the overbought zone (for example, 80-100)
- Example: if stochastic = 15 (is in the range of 1-20), the buy signal will be confirmed
🔌 Connecting to trading strategies
The indicator provides various connectors to connect to your trading strategies.:
1️⃣ Individual connectors for each type of signal
- 🔌Fast vs Slow Up/Down MA Signal🔌: signals for the intersection of fast and slow MA
- 🔌Fast vs Slow Greater/Less MA Signal🔌: signals of the ratio of fast and slow MA
- 🔌Fast Up/Down MA Signal🔌: signals of the intersection of price and fast MA
- 🔌Fast Greater/Less MA Signal🔌: signals of the ratio of price and fast MA
- 🔌Slow Up/Down MA Signal🔌: signals of the intersection of price and slow MA
- 🔌Slow Greater/Less MA Signal🔌: Price versus slow MA signals
2️⃣ Combined connectors
- 🔌Combined Up/Down MA Signal🔌: combines all the crossing signals (Up/Down)
- 🔌Combined Greater/Less MA Signal🔌: combines all the signals of the ratio (Greater/Less)
- 🔌Combined All MA Signals🔌: combines all signals (Up/Down and Greater/Less)
❗️ All connectors return values:
- 1: buy signal
- -1: sell signal
- 0: no signal
📚 How to start using AllMA Trend Radar
1️⃣ Selection of types of moving averages
- Add an indicator to the chart
- Select the type and period for the fast MA (default: DEMA with a period of 14)
- Select the type and period for the slow MA (default: SMA with a period of 14)
- Experiment with different types of MA to find the best combination for your trading style
2️⃣ Signal settings
- Turn on the desired signal types (Up/Down, Greater/Less)
- Set the minimum distance between the signals
- Activate and configure the necessary filters (RSI, MFI, Stochastic)
3️⃣ Checking on historical data
- Analyze how the indicator works based on historical data
- Pay attention to the accuracy of the signals and the presence of false alarms
- Adjust the settings if necessary
4️⃣ Introduction to the trading strategy
- Decide which signals will be used to enter the position.
- Determine which signals will be used to exit the position.
- Connect the indicator to your trading strategy through the appropriate connectors
🌟 Practical application examples
Scalping strategy
- Fast MA: TEMA with a period of 8
- Slow MA: EMA with a period of 21
- Active signals: Fast MA Up/Down
- Filters: RSI (range 1-40 for purchases, 60-100 for sales)
- Signal spacing: 3 bars
Strategy for day trading
- Fast MA: TEMA with a period of 10
- Slow MA: SMA with a period of 20
- Active signals: Fast MA Up/Down and Fast vs Slow Greater/Less
- Filters: MFI (range 1-25 for purchases, 75-100 for sales)
- Signal spacing: 5 bars
Swing Trading Strategy
- Fast MA: DEMA with a period of 14
- Slow MA: VWMA with a period of 30
- Active signals: Fast vs Slow Up/Down and Slow MA Greater/Less
- Filters: Stochastic (range 1-20 for purchases, 80-100 for sales)
- Signal spacing: 8 bars
A strategy for positional trading
- Fast MA: HMA with a period of 21
- Slow MA: SMA with a period of 50
- Active signals: Slow MA Up/Down and Fast vs Slow Greater/Less
- Filters: RSI and MFI at the same time
- The distance between the signals: 10 bars
💡 Tips for using AllMA Trend Radar
1. Select the types of MA for market conditions:
- For trending markets: DEMA, TEMA, HMA (fast MA)
- For sideways markets: SMA, WMA, VWMA (smoothed MA)
- For volatile markets: KAMA, AMA, VAMA (adaptive MA)
2. Combine different types of signals:
- Up/Down signals work better when moving from a sideways trend to a directional
one - Greater/Less signals are optimal for fixing a stable trend
3. Use filters effectively:
- The RSI filter works great in trending markets
- MFI filter helps to confirm the strength of volume movement
- Stochastic filter works well in lateral ranges
4. Adjust the minimum distance between the signals:
- Small values (2-3 bars) for short-term trading
- Average values (5-8 bars) for medium-term trading
- Large values (10+ bars) for long-term trading
5. Use combination connectors:
- For more reliable signals, connect the indicator through the combined connectors
💰 With the AllMA Trend Radar indicator, you get a universal trend analysis tool that can be customized for any trading style and timeframe. The combination of different types of moving averages and advanced filters allows you to significantly improve the accuracy of signals and the effectiveness of your trading strategy!

Multi-Timeframe Trend Table📊 Multi-Timeframe Trend Table
Overview
This powerful trend-tracking tool gives you a real-time snapshot of market trends across multiple timeframes — all in one compact and color-coded table. Designed for traders who want fast, clean, and multi-timeframe awareness at a glance.
⸻
✅ Features
• 7 Key Timeframes Monitored:
2min · 5min · 15min · 1h · 4h · 1d · 1w
• Trend Detection Based on EMAs
Uses a fast (default 20) and slow (default 200) EMA to determine if a timeframe is trending:
• 🟢 Uptrend: Fast EMA is above slow EMA
• 🔴 Downtrend: Slow EMA is above fast EMA
• 🟠 Sideways: EMAs are close (configurable threshold)
• Raw EMA Distance
See the actual difference between fast and slow EMAs for each timeframe — great for gauging trend strength.
• EMA Slope Analysis
A unique “Slope” column tells you the current behavior of EMAs:
• 📈 Pointing Up
• 📉 Pointing Down
• 🔄 Crossing Up/Down
• ➡️ Lateral
• Instant Alerts
Alerts fire the moment a trend flips on any timeframe, keeping you ahead of market shifts.
• Optional Chart EMAs
Toggle on/off the fast and slow EMAs on your active chart for extra clarity.
⸻
🧠 Use Case Examples
• Confirm trades with alignment across multiple timeframes
• Spot early trend reversals with crossing behavior
• Add a higher-timeframe filter to your scalping system
• Monitor key EMAs without changing your chart timeframe
⸻
⚙️ Configuration
• EMA lengths and sideways threshold are fully adjustable
• Enable/disable chart overlays for EMAs
• Table dynamically updates in real time
⸻
💡 Pro Tip: Use this indicator alongside your entry strategy to only trade in the direction of the dominant trends.
⸻
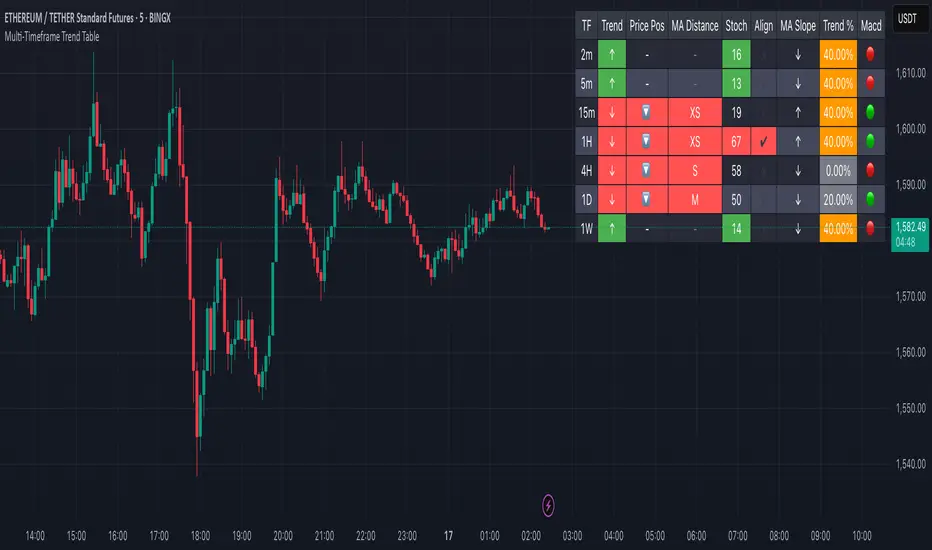
DataDoodles SD + ProbabilityDataDoodles SD + Probability
Overview:
The “DataDoodles SD + Probability” indicator is designed to provide traders with a statistical edge by leveraging standard deviation and probability metrics. This advanced tool calculates the annualized standard deviation, Z-score, and probability of price movements, offering insights into potential market direction with customizable alert thresholds.
Key Features:
1. Annualized Standard Deviation (Volatility) Calculation:
• Uses a user-defined period to compute the rolling standard deviation of daily returns.
• Annualizes the volatility, giving a clear picture of expected price fluctuations.
2. Probability of Price Movement:
• Calculates the probability of price moving up or down using a corrected Z-Score.
• Displays the probability percentage for both upward and downward movements.
3. Dynamic Alerts:
• Configurable alerts for upward and downward price movement probabilities.
• Receive alerts when the probability exceeds user-defined thresholds.
4. Projections and Visuals:
• Plots projected high and low price levels based on annualized volatility.
• Displays Z-Score and probability metrics on the chart for quick reference.
5. Comprehensive Data Table:
• Bottom-center table displays key metrics:
• Daily Return
• Standard Deviation (SD)
• Annualized Standard Deviation (Yearly SD)
User Inputs:
• Annualization Period: Set the time frame for volatility annualization (Default: 252 days).
• SD Period: Define the rolling window for calculating standard deviation (Default: 252 days).
• Alert Probability Up/Down: Customize the probability thresholds for alerts (Default: 90%).
How It Works:
• Data Request and Calculation:
• Uses daily close prices to ensure consistent timeframe calculations.
• Calculates daily returns and annualizes the volatility using the square root of the time frame.
• Probability Computation:
• Employs a normal distribution CDF approximation to compute the probability of upward and downward price movements.
• Adjusts probabilities based on Z-Score to ensure accuracy.
• High and Low Projections:
• Utilizes the annualized volatility to estimate high and low price projections for the year.
• Visual Indicators and Alerts:
• Plots projected high (green) and low (red) levels on the chart.
• Displays Z-Score, probability percentages, and dynamically updates a statistics table.
Use Cases:
• Trend Analysis: Identify high-probability market movements using the probability metrics.
• Volatility Insights: Understand annualized volatility to gauge market risk and potential price ranges.
• Strategic Trading Decisions: Set alerts for high-probability scenarios to optimize entry and exit points.
Why Use “DataDoodles SD + Probability”?
This indicator provides a powerful combination of statistical analysis and visual representation. It empowers traders with:
• Quantitative Edge: By leveraging probability metrics and standard deviation, users can make informed trading decisions.
• Risk Management: Annualized volatility projections help in setting realistic stop-loss and take-profit levels.
• Actionable Alerts: Customizable probability alerts ensure users are notified of potential market moves, allowing proactive trading strategies.
Recommended Settings:
• Annualization Period: 252 (Ideal for daily data representing a trading year)
• SD Period: 252 (One trading year for consistent volatility calculations)
• Alert Probability: Set to 90% for conservative signals or lower for more frequent alerts.
Final Thoughts:
The “DataDoodles SD + Probability” indicator is a robust tool for traders looking to integrate statistical analysis into their trading strategies. It combines volatility measurement, probability calculations, and dynamic alerts to provide a comprehensive market overview.
Whether you’re a day trader or a long-term investor, this indicator can enhance your market insight and improve decision-making accuracy.
Disclaimer:
This indicator is a technical analysis tool designed for educational purposes. Past performance is not indicative of future results. Traders are encouraged to perform their own analysis and manage risk accordingly.
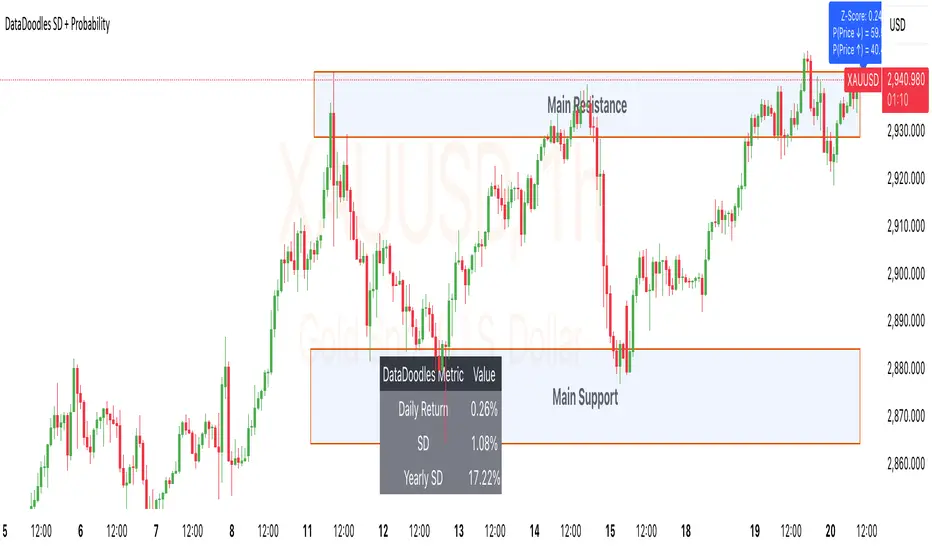
ZenAlgo - Crypto TrendThe ZenAlgo - Crypto Trend indicator is a unique tool for analyzing cryptocurrency market trends, combining data from multiple sources such as BTC , ETH , market caps, dominance metrics, and the DXY index . Unlike standalone indicators, it integrates these data points to deliver actionable insights on macro and micro market movements, helping traders better navigate complex market conditions.
Features
Multi-Asset Trend Analysis: Monitors trends across BTC , ETH , USDT dominance , DXY , SOL , ETHBTC and total market caps ( TOTAL , TOTAL2 , TOTAL3 ), providing a holistic market view.
Dynamic Labels: Real-time market conditions are summarized with labels such as "FIRE SELL," "BTC UP," or "ALT PUMP" for instant clarity.
Customizable Display: Options for dark mode, text size, and table position allow traders to personalize their experience.
Market Sentiment Table: Summarizes trends and percentage changes for multiple assets in a structured, easy-to-read table.
Composite Signals: Identifies unique states like "Mega Boost" or "Outflow" by analyzing the interplay of market trends.
Enhanced Heikin Ashi Analysis: Applies Heikin Ashi trends in a broader context, combining them with other metrics to overcome standalone limitations.
ZenAlgo Theme: A visually distinct and professional theme for enhanced usability.
Added Value: Why Is This Indicator Original/Why Shall You Pay for This Indicator?
The ZenAlgo - Crypto Trend indicator transcends the limitations of free tools in several ways:
Integrated Insights: While Heikin Ashi is freely available, this indicator applies it in tandem with market dominance, total market caps, and macroeconomic indicators like the DXY . This integration creates composite signals (e.g., "Mega Boost," "Defi Mega Boost") that standalone Heikin Ashi cannot provide.
Advanced Contextualization: Free Heikin Ashi indicators lack contextual data about dominance shifts, altcoin performance, and macroeconomic trends. Our indicator integrates these elements to give a broader market perspective.
Time-Saving: Instead of switching between multiple indicators, ZenAlgo - Crypto Trend combines them in one cohesive tool, offering a comprehensive market overview in a single glance.
Custom Features: Unlike generic Heikin Ashi indicators, this tool includes dynamic labels and a market sentiment table that summarize trends and provide immediate insights.
How It Works
1. Heikin Ashi Trend Detection
Calculates smoothed Heikin Ashi trends for BTC , ETH , USDT dominance , DXY , and total market caps ( TOTAL , TOTAL2 , TOTAL3 ).
Functionality: Heikin Ashi values are derived from the weighted average of open, high, low, and close prices. The "open" averages the previous bar's open and close, while the "close" averages the current bar's open, high, low, and close. A trend is assigned as Up (+1) or Down (-1) based on whether the close exceeds the open.
2. Market Metrics Analysis
Tracks daily percentage changes and trends for key metrics like BTC dominance and total market caps.
Outputs: Displays trends (Up/Down) and percentage changes for each asset, helping assess market strength and sentiment.
3. Composite Signal Generation
Combines individual asset trends to define broader market states such as "Mega Boost" or "Outflow."
Logic: Signals are triggered by predefined conditions, e.g., "Mega Boost" occurs when DXY trends down, market caps ( TOTAL , TOTAL2 , TOTAL3 ) trend up, and BTC dominance trends down.
4. Dynamic Labels and Sentiment Table
Displays real-time labels (e.g., "FIRE SELL," "BTC + ALT PUMP") directly on the chart for actionable insights.
A market sentiment table summarizes trends and percentage changes, with customizable display options (position, text size, theme).
Usage Examples
Spotting Bullish Momentum: Use "BTC + ALT PUMP" signals to identify synchronized bullish trends in BTC and altcoins.
Avoiding Bearish Trends: React to "CRYPTO DOWN" or "FIRE SELL" signals to minimize exposure during downturns.
Evaluating Altcoin Opportunities: Identify "ALT PUMP" or "ALTS DUMP" signals to time entries and exits in altcoin markets.
Tracking Dominance Shifts: Monitor "BTC.D UP" or "BTC.D DOWN" trends to assess shifts in market dominance between BTC and altcoins.
Macro Market Awareness: Use "Mega Boost" or "Mega Outflow" states to align with macroeconomic trends, such as dollar strength or weakness.
Seasonal Trends: Observe "ETH PUMP" or "BTC DOWN + ALT PUMP" states to understand specific altcoin or BTC-led market cycles.
Settings
ZenAlgo Theme: Enable a custom ZenAlgo visual style for improved clarity.
Table Text Size: Adjust text size (options: tiny, small, normal, large, huge) for better visibility.
Dark Mode: Toggle dark mode for improved viewing in low-light environments.
Table Position: Choose table placement (e.g., Top Left, Bottom Center) based on your preferences.
Important Notes
Synthetic and Lagging Nature of Heikin Ashi: Heikin Ashi values are synthetic and inherently lagging. They provide smoothed trends but do not represent precise entry or exit points. This indicator does not produce buy or sell signals.
Limitations in Low-Volume Markets: The indicator may underperform in low-liquidity markets or during periods of high volatility, where data discrepancies can distort trends.
Trend Reversals in Choppy Markets: In sideways or choppy markets, the composite signals may lag behind sudden reversals, potentially resulting in delayed recognition of trend changes.
False Positives During Macro News Events: Abrupt macroeconomic news or policy changes can cause the indicator to emit signals (e.g., "Mega Boost") that may not align with sustained market movements.
Dominance Metrics Sensitivity: Heavy reliance on BTC.D or TOTAL3 can sometimes result in misleading insights when these metrics are influenced by atypical events, such as large-scale liquidations or isolated token movements.
Use in Conjunction with Other Tools: While powerful, this indicator should be combined with other technical and fundamental analysis tools for a comprehensive trading strategy.
No Guaranteed Results: Trading involves risk. This tool is designed to support decision-making, not to guarantee trading success.
Broad market index / quantifytools- Overview
Broad market index is a market breadth based oscillator, depicting broad market trend by analysing ratio between symbols moving up and symbols moving down in a given market. When market breadth is positive, more symbols are going up and when negative, more symbols are going down. As markets tend to correlate, broad market trend dictates likely path for all individual symbols that make up the market.
This tool provides market breadth for US equities (based on NYSE advancers - decliners) and ability to build two custom breadth baskets with up to 39 symbols included in each. Market breadth can be customized with variety of smoothing options, weighting and threshold modes to find most optimal rules for trend following. Performance of the model is reflected on metrics showing percentage of up/down moves during bullish/bearish states.
Example
↑ 63% = 63% of price moves during positive breadth state are to the upside
↓ 59% = 59% of price moves during negative breadth state are to the downside
Breadth state is colorized on line and chart according to its state (negative/positive/equilibrium) and direction (trending up/down). Upper and lower bands depict historical turning points in breadth for identifying extremes in broad market trend. Triangles mark breadth thrusts, in other words abnormally large moves in breadth at either upper or lower extreme. Breadth thrusts can serve as early signs of broad market trend reverting.
- Concept and features
By default, market breadth is calculated based on NYSE advancers - decliners, usable for all major indices that depict broad markets in US equities (SP500, QQQ, IWM). Users can also build 2 custom breadth baskets consisting of up to 39 symbols for defining broad market on other asset classes, such as cryptocurrencies. Custom baskets are suitable for any chart that fairly represents a market as a whole.
Example
Basket consisting of cryptocurrencies = Use on CRYPTOCAP:TOTAL (all cryptocurrencies aggregated)
Basket consisting of healthcare stocks = Use on AMEX:XLV (healthcare sector ETF)
Breadth line can be further refined using various smoothing options (SMA, EMA, HMA, RMA, WMA), threshold method and weights. By default, threshold (dividing line between bullish and bearish states) is set to fixed at 0, depicting an equilibrium where equal amount of symbols are going up and down.
Threshold mode can also be set to Dynamic, switching threshold to a moving average of the breadth line. Fundamental functionality still remains, breadth line above threshold marks bullish state and below threshold marks bearish state. Difference here is that the threshold no longer depicts a point of equilibrium, but simply a smoothed version of the breadth line itself, which can catch turns in broad market trend earlier.
Breadth basket can be adjusted to volatility of the viewed chart, causing an overstating of breadth on high volatility and understating on low volatility. Weighting takes into account magnitude of up/down moves, which can provide better relevance for trend following purposes.
- Practical guide
Example #1 : Broad market trend
The utility of market breadth is based on the idea that markets correlate and individual symbols making up the market will eventually join the broad market trend. With this in mind, going against broad market is like swimming upstream, it's going to be the hard way. A well performing basket with clear skew for upside and downside on respective breadth states can be used to form directional bias for trades and risk on/off regimes for investing.
Example #2 : Broad market reversals
Thrusts signify two things: a historical extreme in breadth and an aggressive move to the opposite direction. Thrusts are valuable clues for exhaustion in broad market trend, potentially leading to a reversal.
Example #3 : Breadth/price divergences
Market breadth and price diverging signify events where most symbols that make up the market are going one way but a few high weight symbols (big tech for SP500) are going the other way. In other words, only a few symbols are moving the market while general interest and intention is to the other direction. Divergences in breadth and price are not ideal for sustainable trend and can be expected to eventually revert to the direction of broad market.

Auto Chart Patterns [Trendoscope®]🎲 Introducing our most comprehensive automatic chart pattern recognition indicator.
Last week, we published an idea on how to algorithmically identify and classify chart patterns.
This indicator is nothing but the initial implementation of the idea. Whatever we explained in that publication that users can do manually to identify and classify the pattern, this indicator will do it for them.
🎲 Process of identifying the patterns.
The bulk of the logic is implemented as part of the library - chartpatterns . The indicator is a shell that captures the user inputs and makes use of the library to deliver the outcome.
🎯 Here is the list of steps executed to identify the patterns on the chart.
Derive multi level recursive zigzag for multiple base zigzag length and depth combinations.
For each zigzag and level, check the last 5 pivots or 6 pivots (based on the input setting) for possibility of valid trend line pairs.
If there is a valid trend line pair, then there is pattern.
🎯 Rules for identifying the valid trend line pairs
There should be at least two trend lines that does not intersect between the starting and ending pivots.
The upper trend line should touch all the pivot highs of the last 5 or 6 pivots considered for scanning the patterns
The lower trend line should touch all the pivot lows of the last 5 or 6 pivots considered for scanning the patterns.
None of the candles from starting pivot to ending pivot should fall outside the trend lines (above upper trend line and below lower trend line)
The existence of a valid trend line pair signifies the existence of pattern. What type of pattern it is, to identify that we need to go through the classification rules.
🎲 Process of classification of the patterns.
We need to gather the following information before we classify the pattern.
Direction of upper trend line - rising, falling or flat
Direction of lower trend line - rising, falling or flat
Characteristics of trend line pair - converging, expanding, parallel
🎯 Broader Classifications
Broader classification would include the following types.
🚩 Classification Based on Geometrical Shapes
This includes
Wedges - both trend lines are moving in the same direction. But, the trend lines are either converging or diverging and not parallel to each other.
Triangles - trend lines are moving in different directions. Naturally, they are either converging or diverging.
Channels - Both trend lines are moving in the same direction, and they are parallel to each other within the limits of error.
🚩 Classification Based on Pattern Direction
This includes
Ascending/Rising Patterns - No trend line is moving in the downward direction and at least one trend line is moving upwards
Descending/Falling Patterns - No trend line is moving in the upward direction, and at least one trend line is moving downwards.
Flat - Both Trend Lines are Flat
Bi-Directional - Both trend lines are moving in opposite direction and none of them is flat.
🚩 Classification Based on Formation Dynamics
This includes
Converging Patterns - Trend Lines are converging towards each other
Diverging Patterns - Trend Lines are diverging from each other
Parallel Patterns - Trend Lines are parallel to each others
🎯 Individual Pattern Types
Now we have broader classifications. Let's go through in detail to find out fine-grained classification of each individual patterns.
🚩 Ascending/Uptrend Channel
This pattern belongs to the broader classifications - Ascending Patterns, Parallel Patterns and Channels. The rules for the Ascending/Uptrend Channel pattern are as below
Both trend lines are rising
Trend lines are parallel to each other
🚩 Descending/Downtrend Channel
This pattern belongs to the broader classifications - Descending Patterns, Parallel Patterns and Channels. The rules for the Descending/Downtrend Channel pattern are as below
Both trend lines are falling
Trend lines are parallel to each other
🚩 Ranging Channel
This pattern belongs to the broader classifications - Flat Patterns, Parallel Patterns and Channels. The rules for the Ranging Channel pattern are as below
Both trend lines are flat
Trend lines are parallel to each other
🚩 Rising Wedge - Expanding
This pattern belongs to the broader classifications - Rising Patterns, Diverging Patterns and Wedges. The rules for the Expanding Rising Wedge pattern are as below
Both trend lines are rising
Trend Lines are diverging.
🚩 Rising Wedge - Contracting
This pattern belongs to the broader classifications - Rising Patterns, Converging Patterns and Wedges. The rules for the Contracting Rising Wedge pattern are as below
Both trend lines are rising
Trend Lines are converging.
🚩 Falling Wedge - Expanding
This pattern belongs to the broader classifications - Falling Patterns, Diverging Patterns and Wedges. The rules for the Expanding Falling Wedge pattern are as below
Both trend lines are falling
Trend Lines are diverging.
🚩 Falling Wedge - Contracting
This pattern belongs to the broader classifications - Falling Patterns, Converging Patterns and Wedges. The rules for the Converging Falling Wedge are as below
Both trend lines are falling
Trend Lines are converging.
🚩 Rising/Ascending Triangle - Expanding
This pattern belongs to the broader classifications - Rising Patterns, Diverging Patterns and Triangles. The rules for the Expanding Ascending Triangle pattern are as below
The upper trend line is rising
The lower trend line is flat
Naturally, the trend lines are diverging from each other
🚩 Rising/Ascending Triangle - Contracting
This pattern belongs to the broader classifications - Rising Patterns, Converging Patterns and Triangles. The rules for the Contracting Ascending Triangle pattern are as below
The upper trend line is flat
The lower trend line is rising
Naturally, the trend lines are converging.
🚩 Falling/Descending Triangle - Expanding
This pattern belongs to the broader classifications - Falling Patterns, Diverging Patterns and Triangles. The rules for the Expanding Descending Triangle pattern are as below
The upper trend line is flat
The lower trend line is falling
Naturally, the trend lines are diverging from each other
🚩 Falling/Descending Triangle - Contracting
This pattern belongs to the broader classifications - Falling Patterns, Converging Patterns and Triangles. The rules for the Contracting Descending Triangle pattern are as below
The upper trend line is falling
The lower trend line is flat
Naturally, the trend lines are converging.
🚩 Converging Triangle
This pattern belongs to the broader classifications - Bi-Directional Patterns, Converging Patterns and Triangles. The rules for the Converging Triangle pattern are as below
The upper trend line is falling
The lower trend line is rising
Naturally, the trend lines are converging.
🚩 Diverging Triangle
This pattern belongs to the broader classifications - Bi-Directional Patterns, Diverging Patterns and Triangles. The rules for the Diverging Triangle pattern are as below
The upper trend line is rising
The lower trend line is falling
Naturally, the trend lines are diverging from each other.
🎲 Indicator Settings - Auto Chart Patterns
🎯 Zigzag Settings
Zigzag settings allow users to select the number of zigzag combinations to be used for pattern scanning, and also allows users to set zigzag length and depth combinations.
🎯 Scanning Settings
Number of Pivots - This can be either 5 or 6. Represents the number of pivots used for identification of patterns.
Error Threshold - Error threshold used for initial trend line validation.
Flat Threshold - Flat angle threshold is used to identify the slope and direction of trend lines.
Last Pivot Direction - Filters patterns based on the last pivot direction. The values can be up, down, both, or custom. When custom is selected, then the individual pattern specific last pivot direction setting is used instead of the generic one.
Verify Bar Ratio - Provides option to ignore extreme patterns where the ratios of zigzag lines are not proportionate to each other.
Avoid Overlap - When selected, the patterns that overlap with existing patterns will be ignored while scanning. Meaning, if the new pattern starting point falls between the start and end of an existing pattern, it will be ignored.
🎯 Group Classification Filters
Allows users to enable disable patterns based on group classifications.
🚩 Geometric Shapes Based Classifications
Wedges - Rising Wedge Expanding, Falling Wedge Expanding, Rising Wedge Contracting, Falling Wedge Contracting.
Channels - Ascending Channel, Descending Channel, Ranging Channel
Triangles - Converging Triangle, Diverging Triangle, Ascending Triangle Expanding, Descending Triangle Expanding, Ascending Triangle Contrcting and Descending Triangle Contracting
🚩 Direction Based Classifications
Rising - Rising Wedge Contracting, Rising Wedge Expanding, Ascending Triangle Contracting, Ascending Triangle Expanding and Ascending Channel
Falling - Falling Wedge Contracting, Falling Wedge Expanding, Descending Triangle Contracting, Descending Triangle Expanding and Descending Channel
Flat/Bi-directional - Ranging Channel, Converging Triangle, Diverging Triangle
🚩 Formation Dynamics Based Classifications
Expanding - Rising Wedge Expanding, Falling Wedge Expanding, Ascending Triangle Expanding, Descending Triangle Expanding, Diverging Triangle
Contracting - Rising Wedge Contracting, Falling Wedge Contracting, Ascending Triangle Contracting, Descending Triangle Contracting, Converging Triangle
Parallel - Ascending Channel, Descending Channgel and Ranging Channel
🎯 Individual Pattern Filters
These settings allow users to enable/disable individual patterns and also set last pivot direction filter individually for each pattern. Individual Last Pivot direction filters are only considered if the main "Last Pivot Direction" filter is set to "custom"
🎯 Display Settings
These are the settings that determine the indicator display. The details are provided in the tooltips and are self explanatory.
🎯 Alerts
A basic alert message is enabled upon detection of new pattern on the chart.

Multi-Timeframe EMA Tracker by Ox_kaliThis script is an advanced trend analysis indicator crafted for traders who seek a detailed and customizable view of market trends across multiple timeframes. This tool utilizes exponential moving averages (EMAs) to offer insights into market direction and momentum.
Key Features:
Multi-Timeframe Analysis: MTEMA-Tracker covers a wide range of timeframes, including 1, 2, 3, 5, 10, 15, 30 minutes; 1, 2, 4, 6, 12 hours; 1 day; and 1 week. This allows traders to analyze market trends from various perspectives, from short-term fluctuations to longer-term movements.
EMA-Based Trend Determination: The indicator employs two EMAs (50 and 200 periods) for each timeframe to ascertain the market trend. A higher EMA50 compared to EMA200 indicates an uptrend, while the opposite scenario suggests a downtrend.
User-Defined Trend Colors: Traders can personalize the appearance of the trend lines with custom colors for upward and downward trends, enhancing visual clarity and quick interpretation.
Selectable Timeframe Display: MTEMA-Tracker by Ox_kali offers the flexibility to choose which timeframes to display, enabling traders to focus on the most relevant data for their trading strategy.
Average Trend Calculation: A unique feature of MTEMA-Tracker is its ability to compute the average trend across all selected timeframes, providing a holistic view of the market's general direction.
List of Parameters:
Color of the trend: Customizable color settings for both upward and downward trends.
Settings for the Lengths of the EMAs: Options to set the lengths of the short and long-term EMAs.
Display Options for Each Timeframe's EMA Trend: Ability to activate or deactivate the display of EMAs for each selected timeframe.
Indicators and Financial Name Label settings: To ensure maximum clarity and understanding of the displayed trends, users should not hesitate to use the function to display "indicators and financial name labels" in their settings. This feature will help in identifying the legends for each trend, making it easier to interpret the market direction for the selected timeframes.
Please note that the MTEMA-Tracker is not a guarantee of future market performance and should be used in conjunction with proper risk management. Always ensure that you have a thorough understanding of the indicator’s methodology and its limitations before making any investment decisions. Additionally, past performance is not indicative of future results.
2B Reversal Pattern (Expo)█ Overview
The 2B reversal pattern , also called the "spring pattern", is a popular chart pattern professional traders use to identify potential trend reversals. It occurs when the price appears to be breaking down or up and then suddenly bounces back up/down, forming a "spring" or "false breakout" pattern. This pattern indicates that the trend is losing momentum and that a reversal is coming.
In a bearish market , the "spring pattern" occurs when the price of an asset breaks below a support level, causing many traders to sell their positions and causing the price to drop even further. However, the selling pressure eases at some point, and the price begins to rebound, "springing" back above the support level. This rebound creates a long opportunity for traders who can enter the market at a lower price.
In a bullish market , the "spring pattern" occurs when the price of an asset breaks above a resistance level, causing many traders to buy into the asset and drive the price up even further. However, the buying pressure eases at some point, and the price begins to decline, "springing" below the resistance level. This decline creates a selling opportunity for traders who can short the market at a higher price.
█ What are the benefits of using the 2B Reversal Pattern?
The benefits of using the 2B Reversal pattern as a trader include identifying potential buying or selling opportunities with reduced risk. By waiting for the price to "spring back" to the initial breakout level, traders can avoid entering the market too soon and minimize the risk of potential losses.
█ How to use
Traders can use the 2B reversal pattern to identify reversals. If the pattern occurs after an uptrend, traders may sell their long positions or enter a short position, anticipating a reversal to a downtrend. If the pattern occurs after a downtrend, traders may sell their short positions or enter a long position, anticipating a reversal to an uptrend.
█ Consolidation Strategy
First, traders should identify a period of price consolidation or a trading range where the price has been trading sideways for some time. The key feature of the "spring pattern" is a sudden, sharp move downward/upwards through the lower/upper boundary of this trading range, often accompanied by high volume.
However, instead of continuing to move lower/higher, the price then quickly recovers and moves back into the trading range, often on low volume. This quick recovery is the "spring" part of the pattern and suggests that the market has rejected the lower/higher price and that buying/selling pressure is building.
Traders may use the "spring pattern" as a signal to buy/sell the asset, suggesting strong demand/supply for the stock at the lower/higher price level. However, as with all trading strategies, it is important to use other indicators and to manage risk to minimize potential losses carefully.
-----------------
Disclaimer
The information contained in my Scripts/Indicators/Ideas/Algos/Systems does not constitute financial advice or a solicitation to buy or sell any securities of any type. I will not accept liability for any loss or damage, including without limitation any loss of profit, which may arise directly or indirectly from the use of or reliance on such information.
All investments involve risk, and the past performance of a security, industry, sector, market, financial product, trading strategy, backtest, or individual's trading does not guarantee future results or returns. Investors are fully responsible for any investment decisions they make. Such decisions should be based solely on an evaluation of their financial circumstances, investment objectives, risk tolerance, and liquidity needs.
My Scripts/Indicators/Ideas/Algos/Systems are only for educational purposes!
Volume Breakouts v2The Volume Breakouts Indicator 2.0 is a comprehensive improvement on its predecessor "Volume Breakouts" with new features and improved performance. It offers high customization options where almost every aspect can be changed to suit your preferences.
The main functionality of the indicator is to display volume that exceeds a certain level of relative volume with a specific color, and now it also differentiates between strong up and strong down days. The legacy mode from the previous version is still available, and the calculation error has been corrected in the legacy mode.
Volume Bars in their default configuration are determined by the following factors: Up and Down days, relative volume , and a strong/weak close range. The strong/weak close range is determined by marking bars with a "strong" color only if the close price is higher/weaker than 60% or 40% of the candlestick range - otherwise the color gets downgraded by one level (for example from strong green upday to medium strong blue upday). The main options for Volume Bars are the "Multipliers", where a multiplier of 1.5 represents 150% relative volume . For example, if there is an up day closing above 60% of its range and the volume is above the defined moving average threshold times the multiplier, the bar will be colored green.
(the option: "Strong/week close range" is optional and can be disabled)
Upday and multiplier 2: green
Upday and multiplier 1: blue
Downday and multiplier 2: red
Downday and multiplier 1: pink
The indicator also integrates Pocket Pivots , which are displayed as "star" icons above the current volume bar. There are two types of Pocket Pivots:
The day's volume should be larger than the highest down volume day over the prior 10 days (Rule No. 3, Chris Kacher)
If the pocket pivot occurs in an uptrend after the stock has broken out, it should act constructively around its 10-dma." The star will appear in black if the first condition is met and red if the second condition is met. (Rule No. 4, Chris Kacher)
The signal (star) will appear in black if the first condition is met and red if the second condition is met.
A new addition to the indicator is the Dashboard of different variables, which can be individually enabled or disabled. These variables include:
Actual volume: the volume of the most recent bar
Actual dollar volume: the amount of $ traded on the most recent bar
Average volume: the average volume over a defined period of time (same as moving average)
Average dollar volume: the amount of $ traded over a defined period of time (same as moving average)
Relative volume: the relative value of the current bar compared to the moving average of the volume
Up/down volume ratio: the total of the stock's volume on days when it closes up divided by the volume traded on days when the stock closed down. The assumption is that if a stock closes up for the day, the volume was buying induced and thus the stock is under accumulation
Free floating shares: Free float, also known as public float, refers to the shares of a company that can be publicly traded and are not restricted (for example held by insiders)
Rocket Ratio: Is a value (Formula: Float/AvgVolume) which measures the liquidity of the stock. A lower value means that fewer shares can move the stock fast. The default threshold is < 150
All colors can be customized, and there is also a predefined option for dark mode.
